Collection Analytics and AI Insights
Trimlink offers an advanced dashboard made just for Collections. You do not have to check links one by one and add up the numbers yourself. Collection Analytics automatically combines the data of every short link and landing page in your folder into one view.
This dashboard lets you track total engagement, filter out specific URLs, view global map trends, and get AI tips all in one place.
Accessing Collection Analytics
To view the combined performance of your campaign:
- Sign in to Trimlink and choose your workspace.
- Click Collections on the left menu.
- Find the collection you want in your library.
- Click View Details to open the dashboard.
Phase 1: Collection Details & URL Filtering
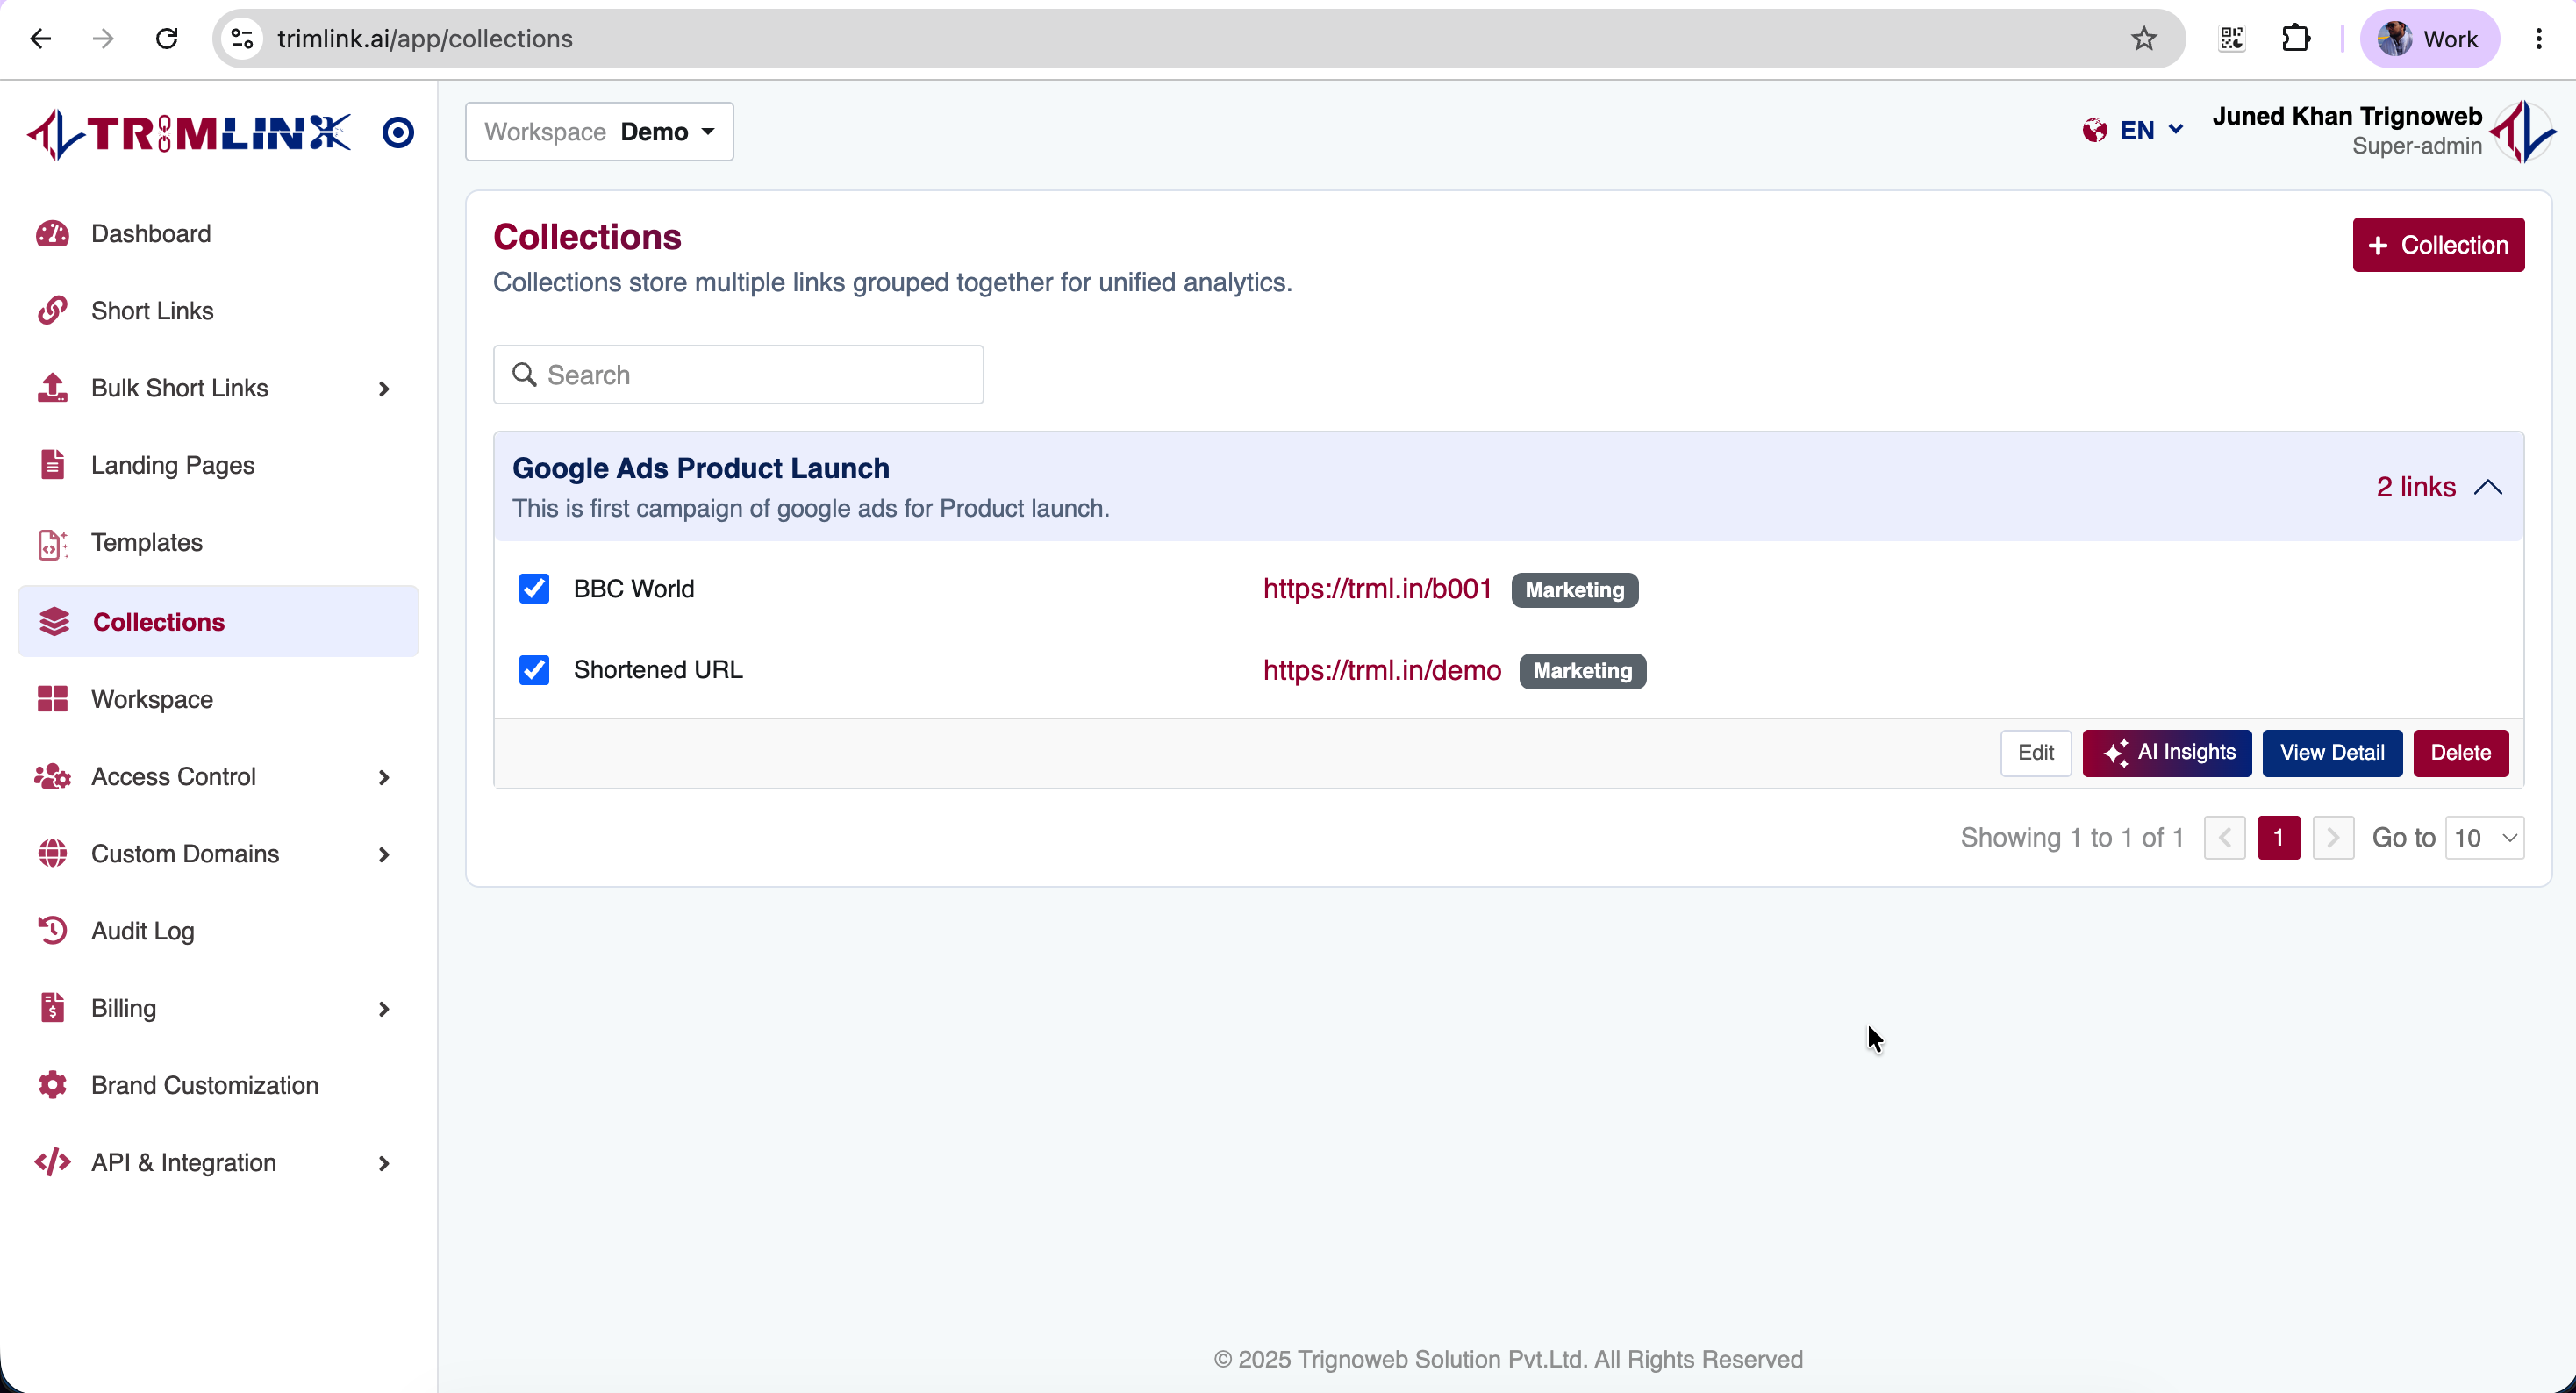
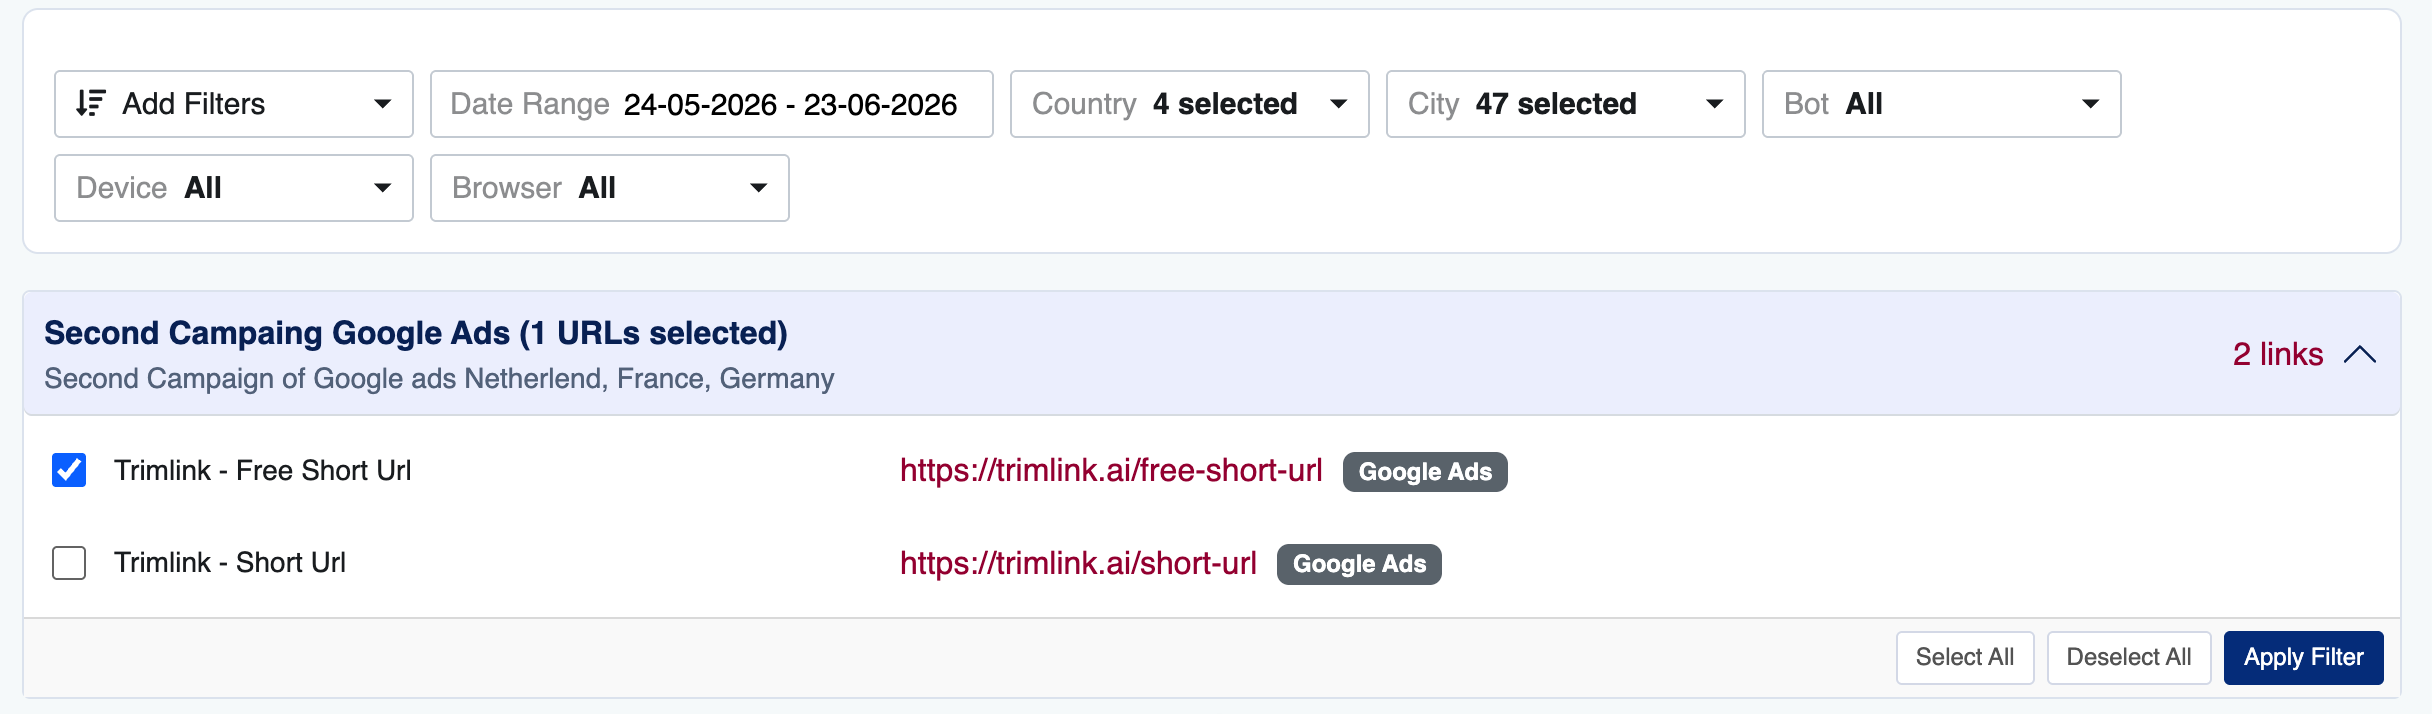
At the top of the dashboard, you will see your collection details. This section lets you choose exactly what data to look at.
Reviewing Assigned URLs
Here, you can see a list of every link in this collection. It shows the Link Title, Short URL, Destination URL, Status, and Creation Date. This tells you exactly what is running in your campaign.
URL Filtering (Data Control)
Sometimes you want to view the campaign without certain links changing the numbers. For example, you might want to hide a test link or a bad ad.
- How it works: Uncheck boxes in the URL list to hide specific links.
- The Result: The moment you hide a link, the entire dashboard below updates instantly. Total clicks, map clusters, and AI tips will only show data for the links you keep checked.
Phase 2: Analytics Overview Dashboard
Right below the URL list is the Overview Dashboard. This screen gives you a quick snapshot of how your whole campaign is doing.
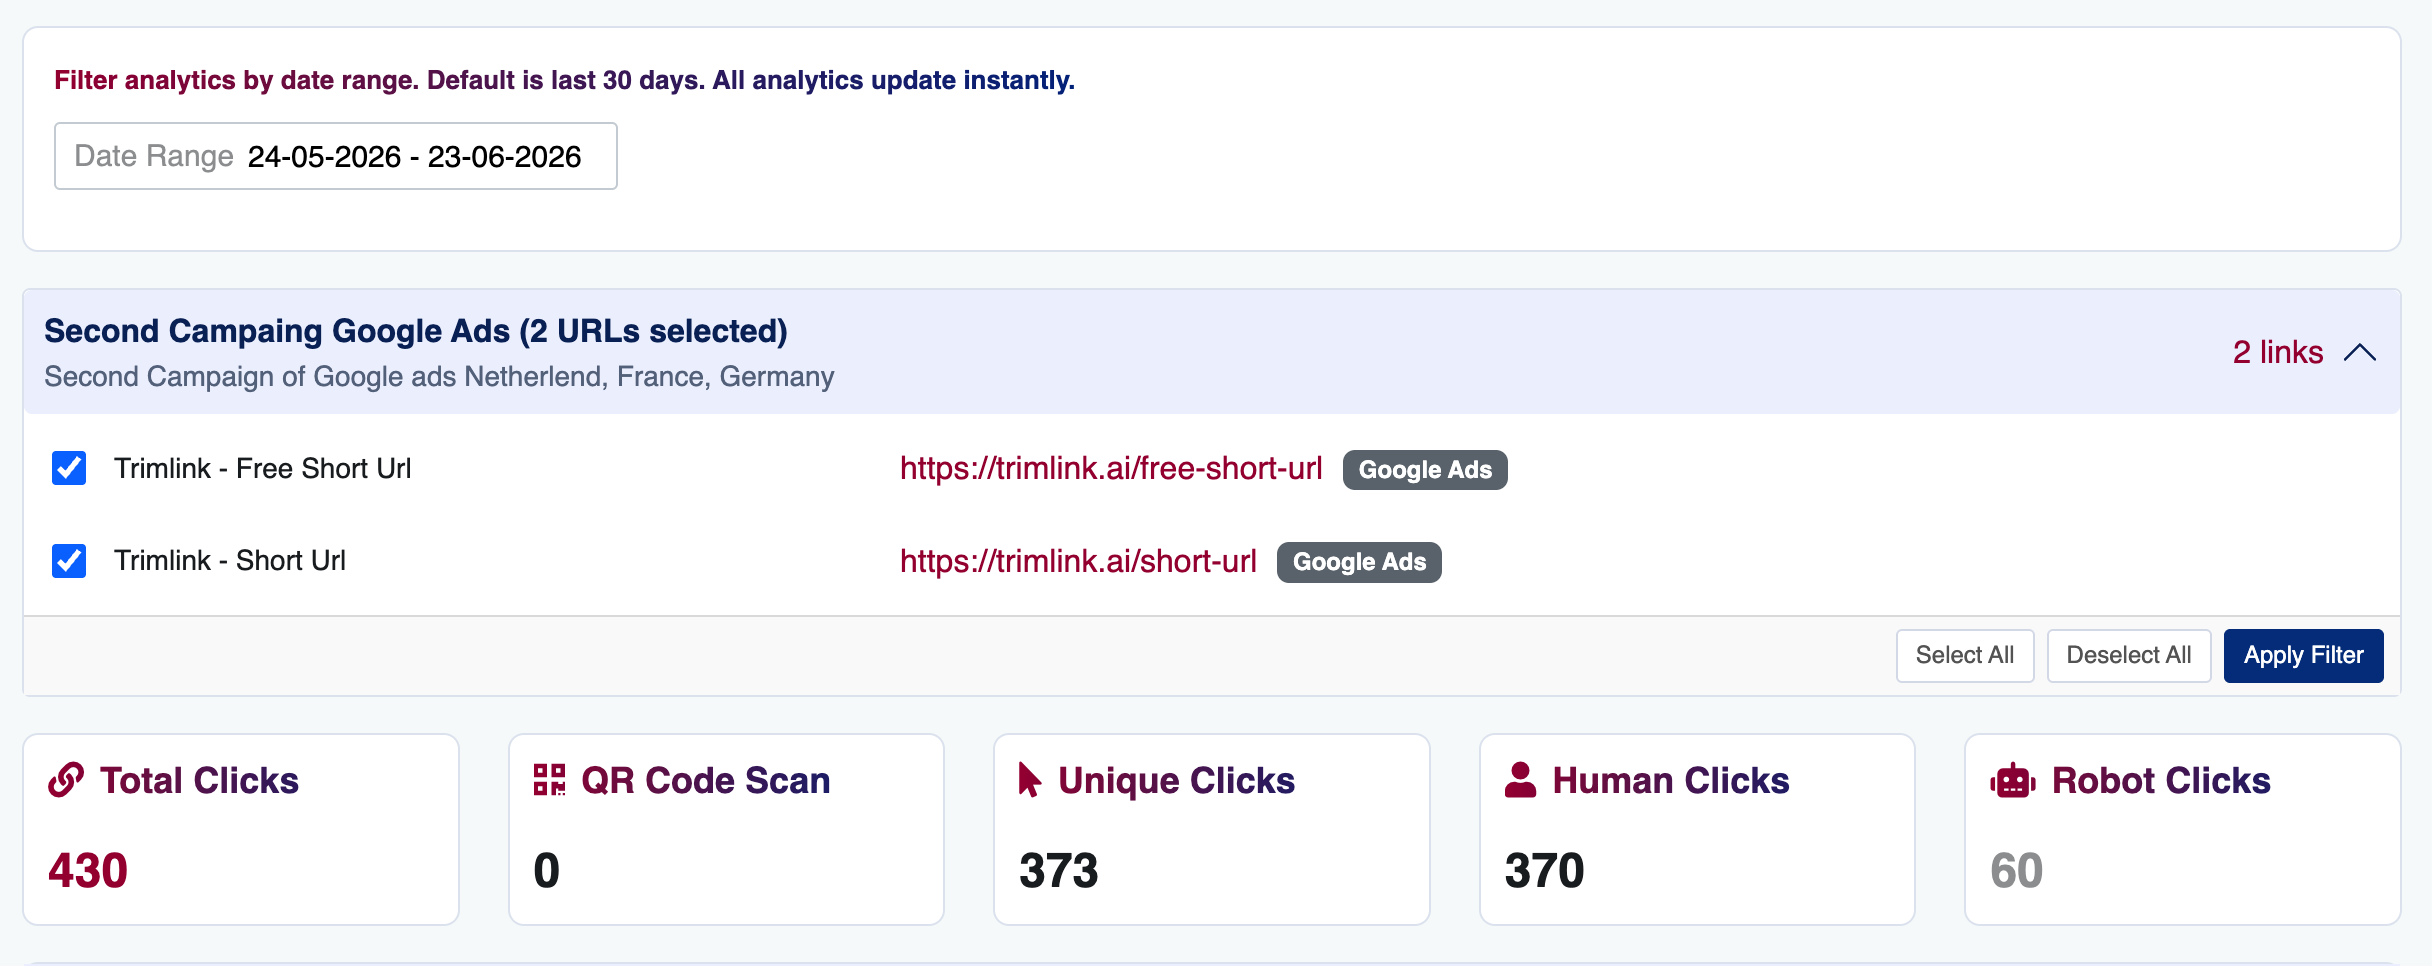
1. Main Metrics & Date Filtering
Use the Date Range at the top to filter your view. The main numbers will update for the dates you pick:
- Total Clicks: Every single click across the whole collection.
- Unique Clicks: The number of different people who clicked. (This ignores people who clicked multiple times.)
- QR Code Scans: The total number of offline scans across all links.
- Human vs. Bot Clicks: A clear split between real people and computer bots.
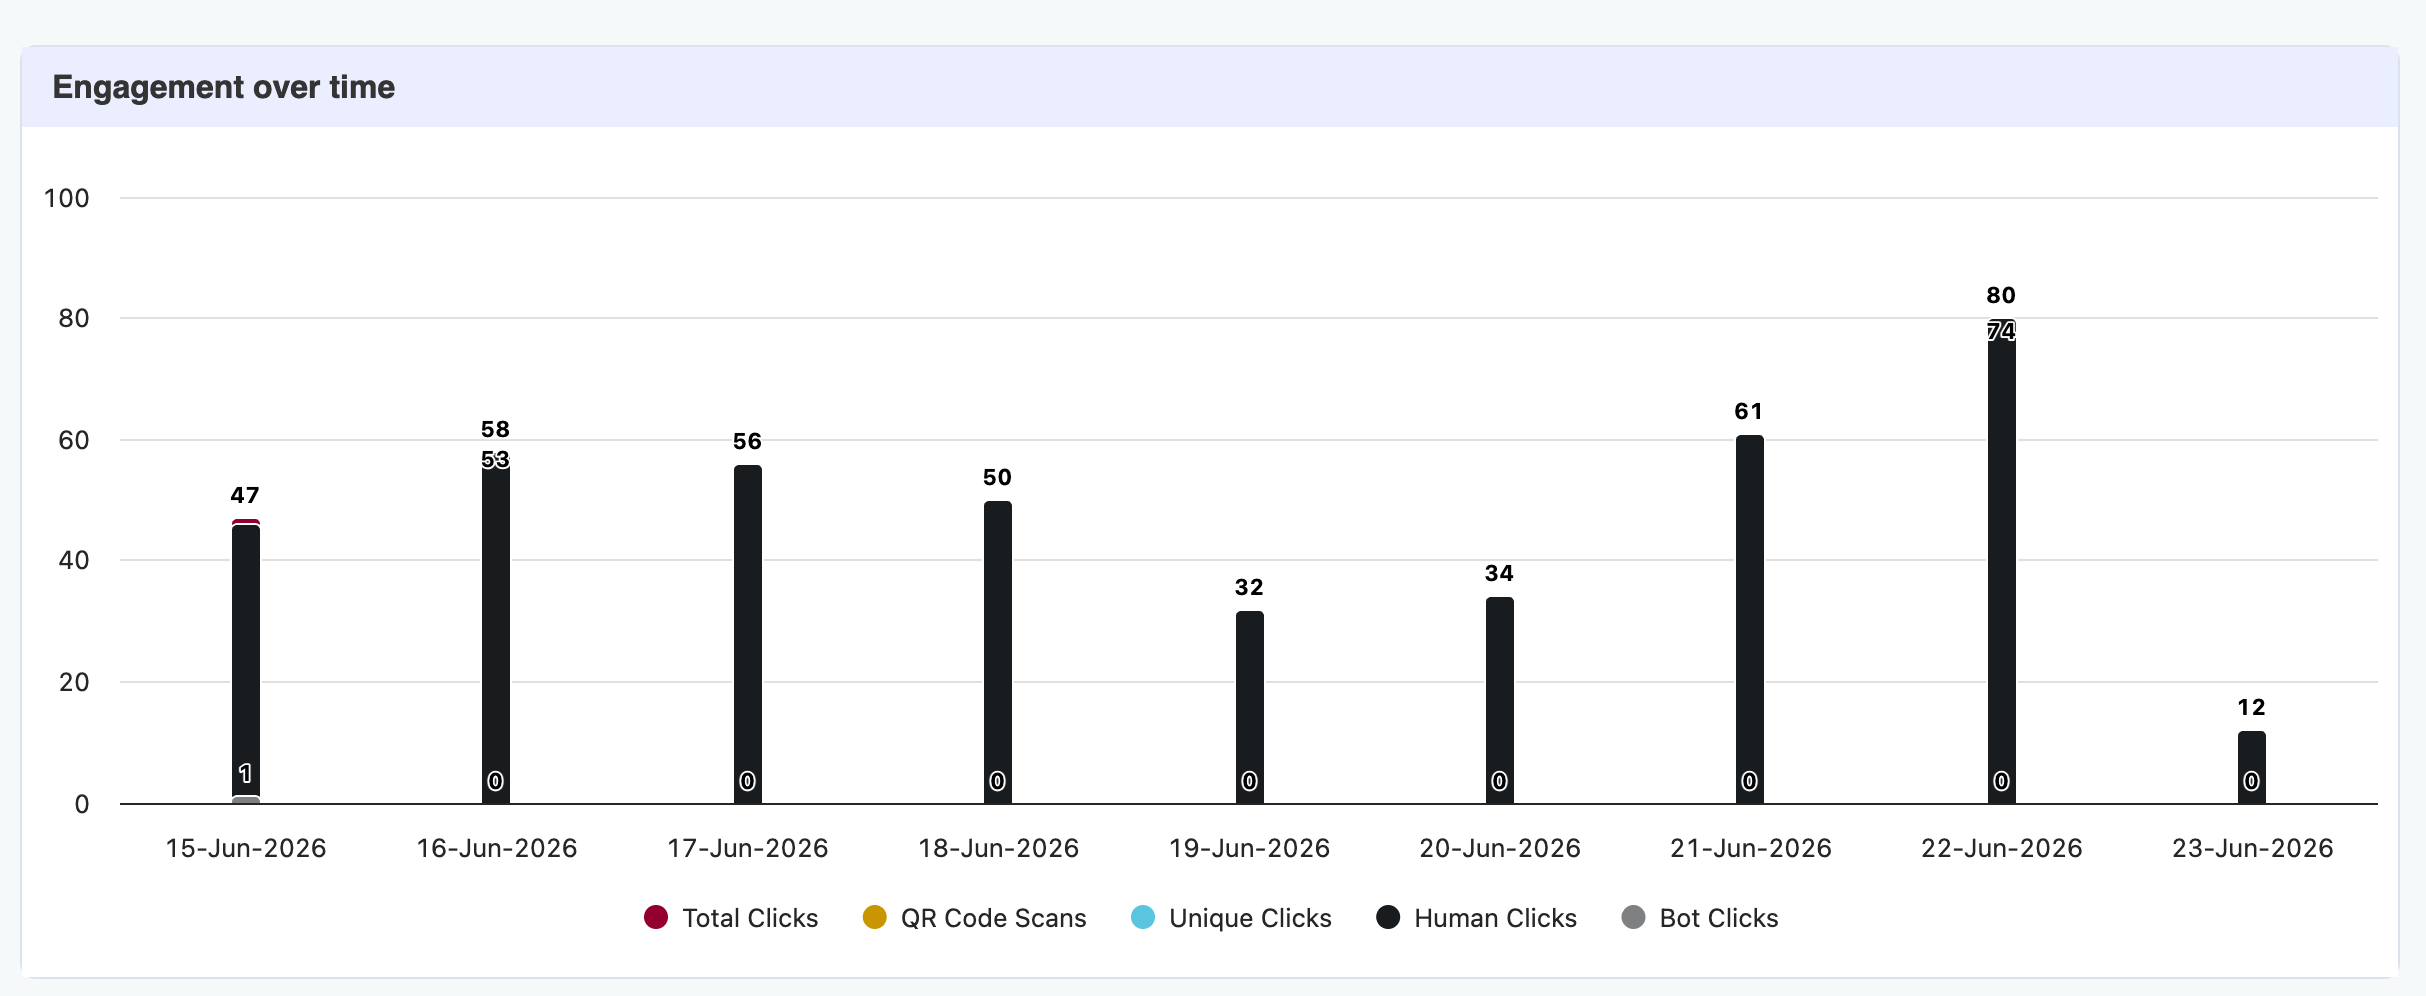
2. Engagement Over Time
This bar chart shows your daily traffic. Since it tracks all links at once, you can easily spot traffic spikes, seasonal trends, or when people stop clicking.
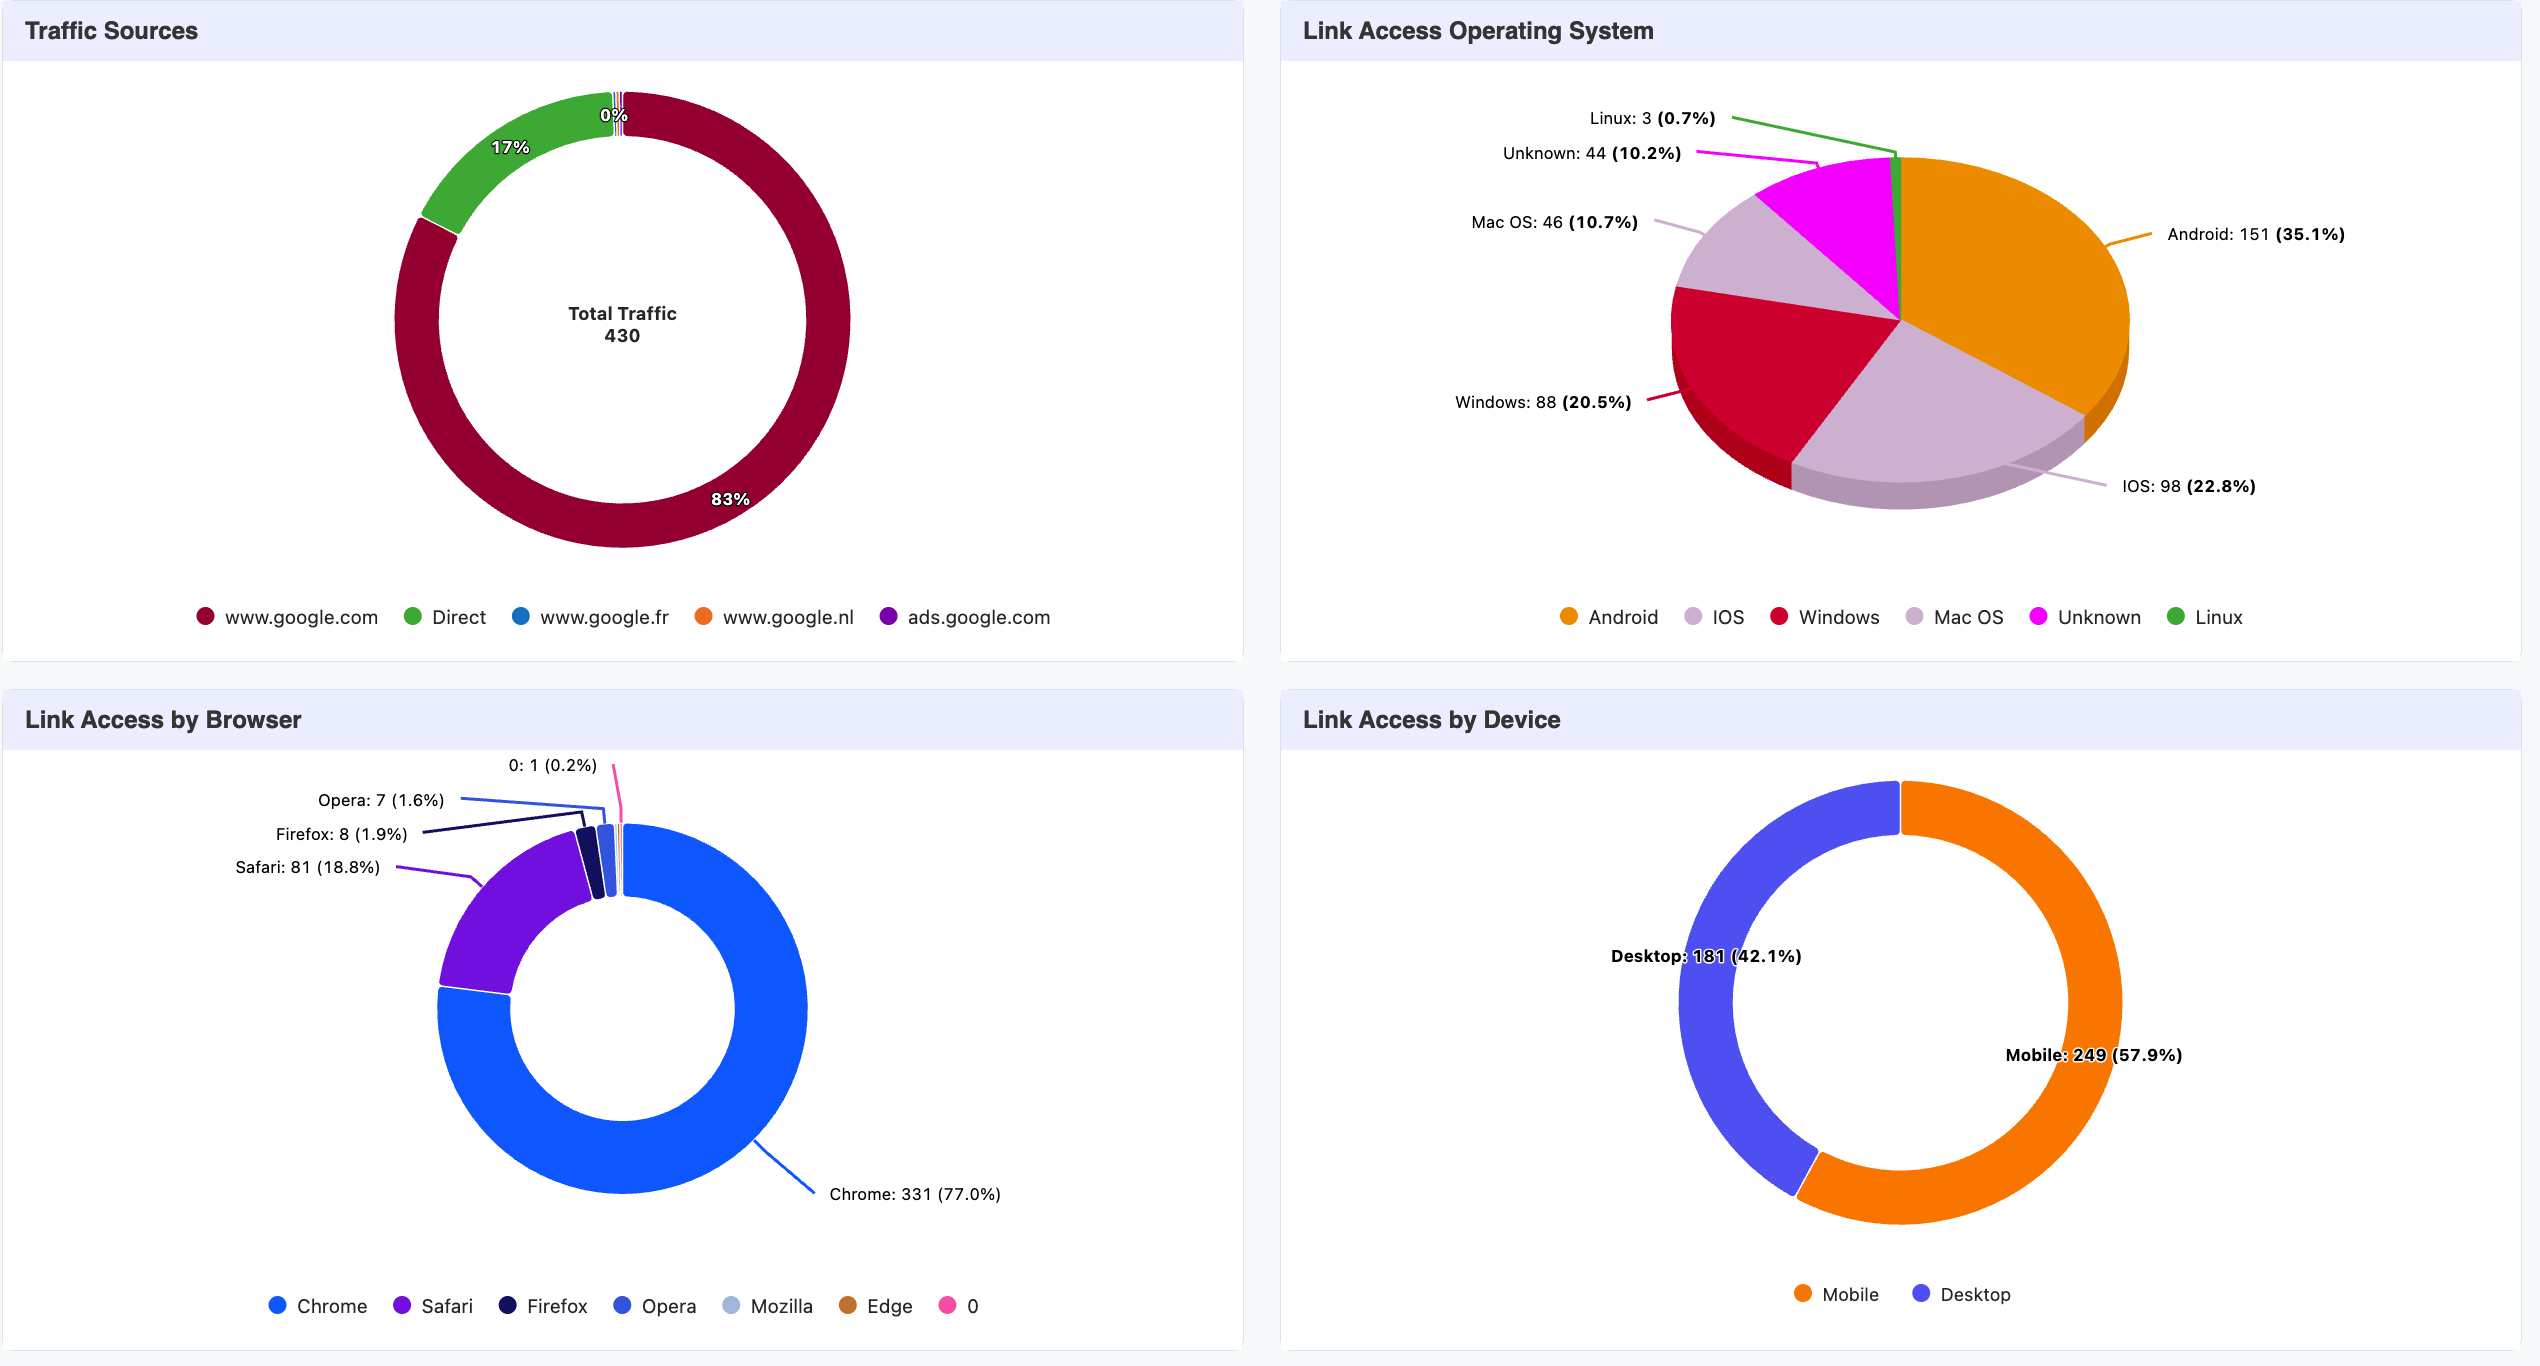
3. Traffic & Technology Details
To help you improve your pages and ad spend, the dashboard shows your audience details in clean pie charts:
- Traffic Sources: See which platforms (like Google, Facebook, or Email) bring in the most visits.
- Technology: See what Operating Systems, Browsers, and Devices (Desktop, Mobile, or Tablet) your audience uses most.
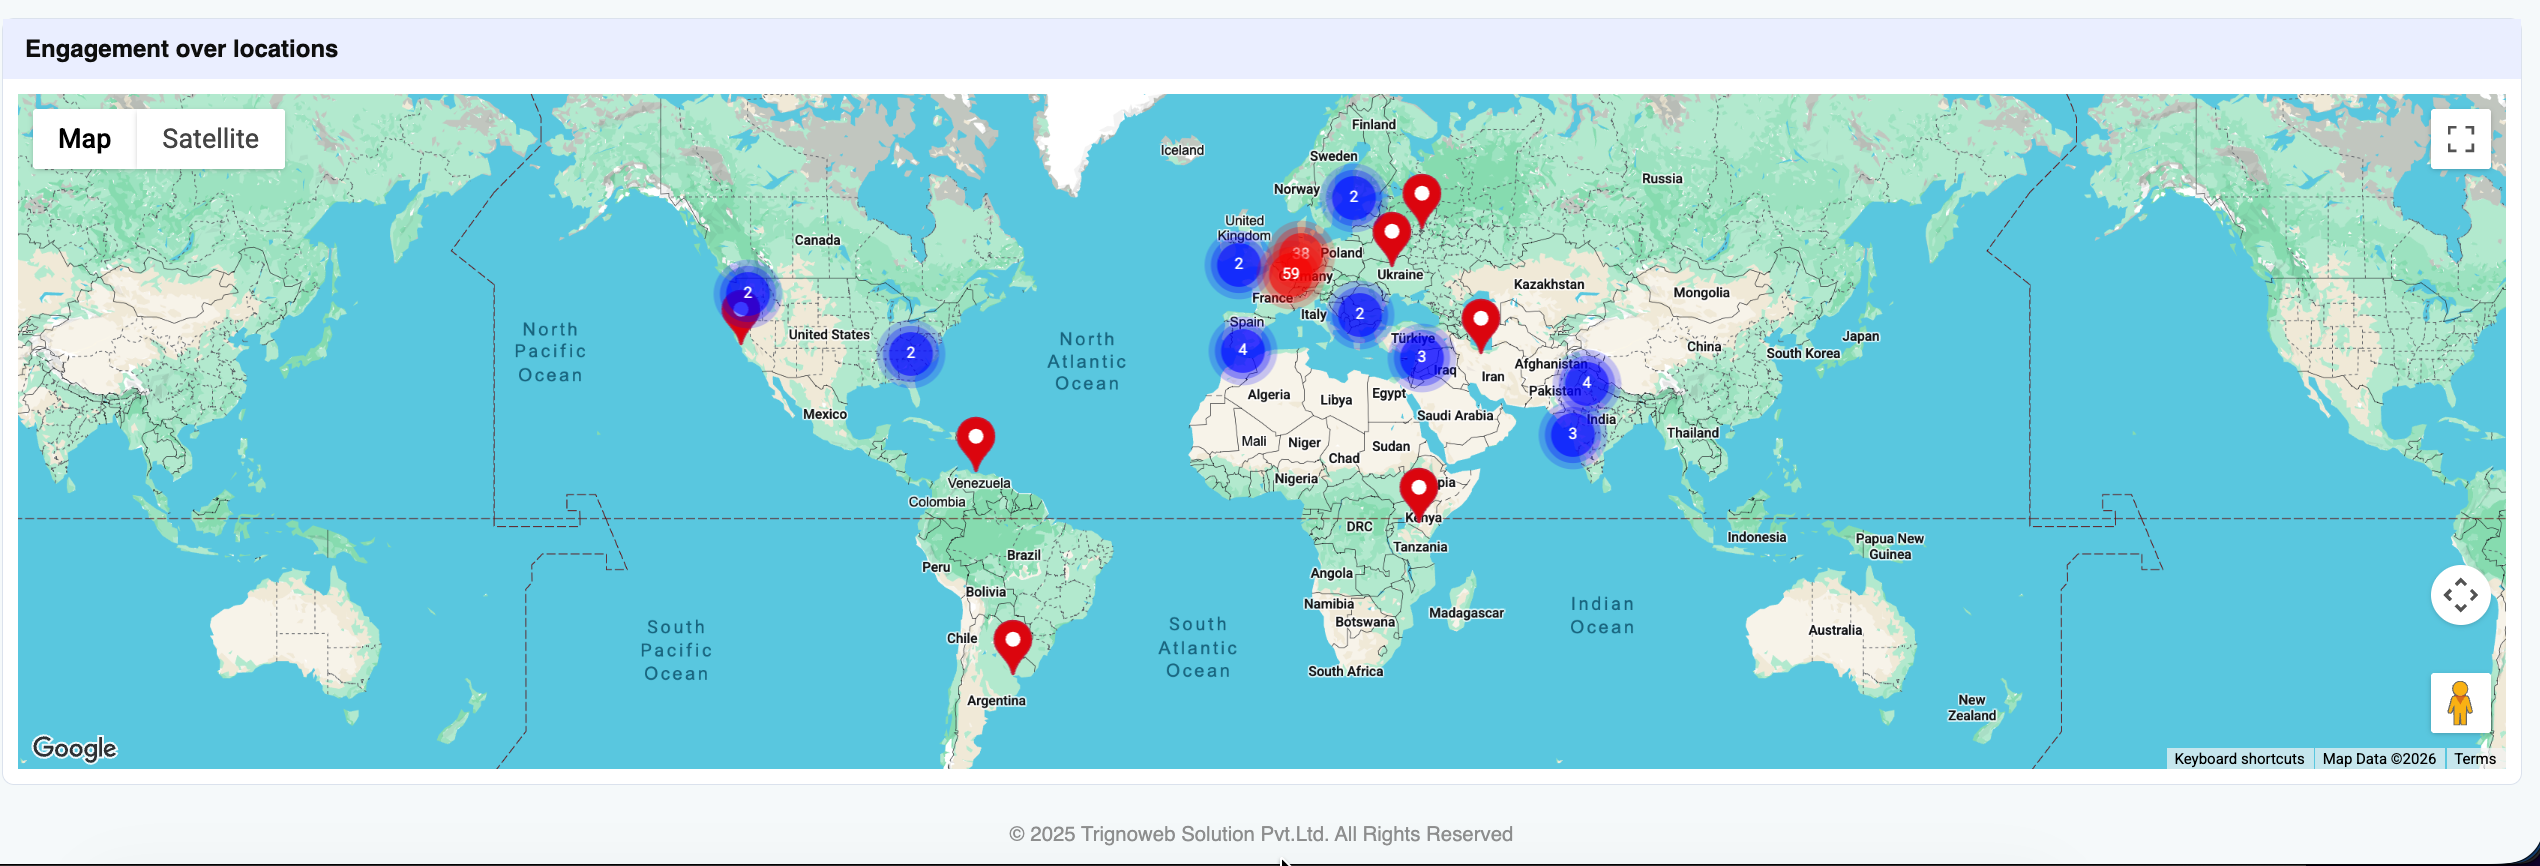
4. Interactive Global Map
- Intelligent Clustering: To prevent the map from becoming unreadable with thousands of overlapping pins, nearby visitors from all links are grouped into clean, numbered bubble clusters.
- Density Analysis: Larger clusters immediately highlight your geographic hotspots and regional engagement trends for the entire campaign.
Exploring Map Clusters: When multiple visitors originate from nearby locations, they are grouped. To investigate where your audience is concentrated:
- Scroll down to the Interactive Map.
- Click on a specific cluster marker to automatically zoom into that region.
- Review the grouped visitor information that appears.
- Click View Detail inside the cluster marker to transition directly into the deep-dive analytics screen (Phase 3), where you can apply advanced filters to that specific geographic segment.
Phase 3: Deep Dive Analytics & The IP List
To look closely at specific areas or audience groups, click View Detail on any map circle. This opens the Detailed Analytics screen.
1. Advanced Filtering
This screen offers better filters. You can combine different rules to find exact groups of people.
- Example: You can filter to show only Mobile users, using Chrome, located in London, who clicked in July.
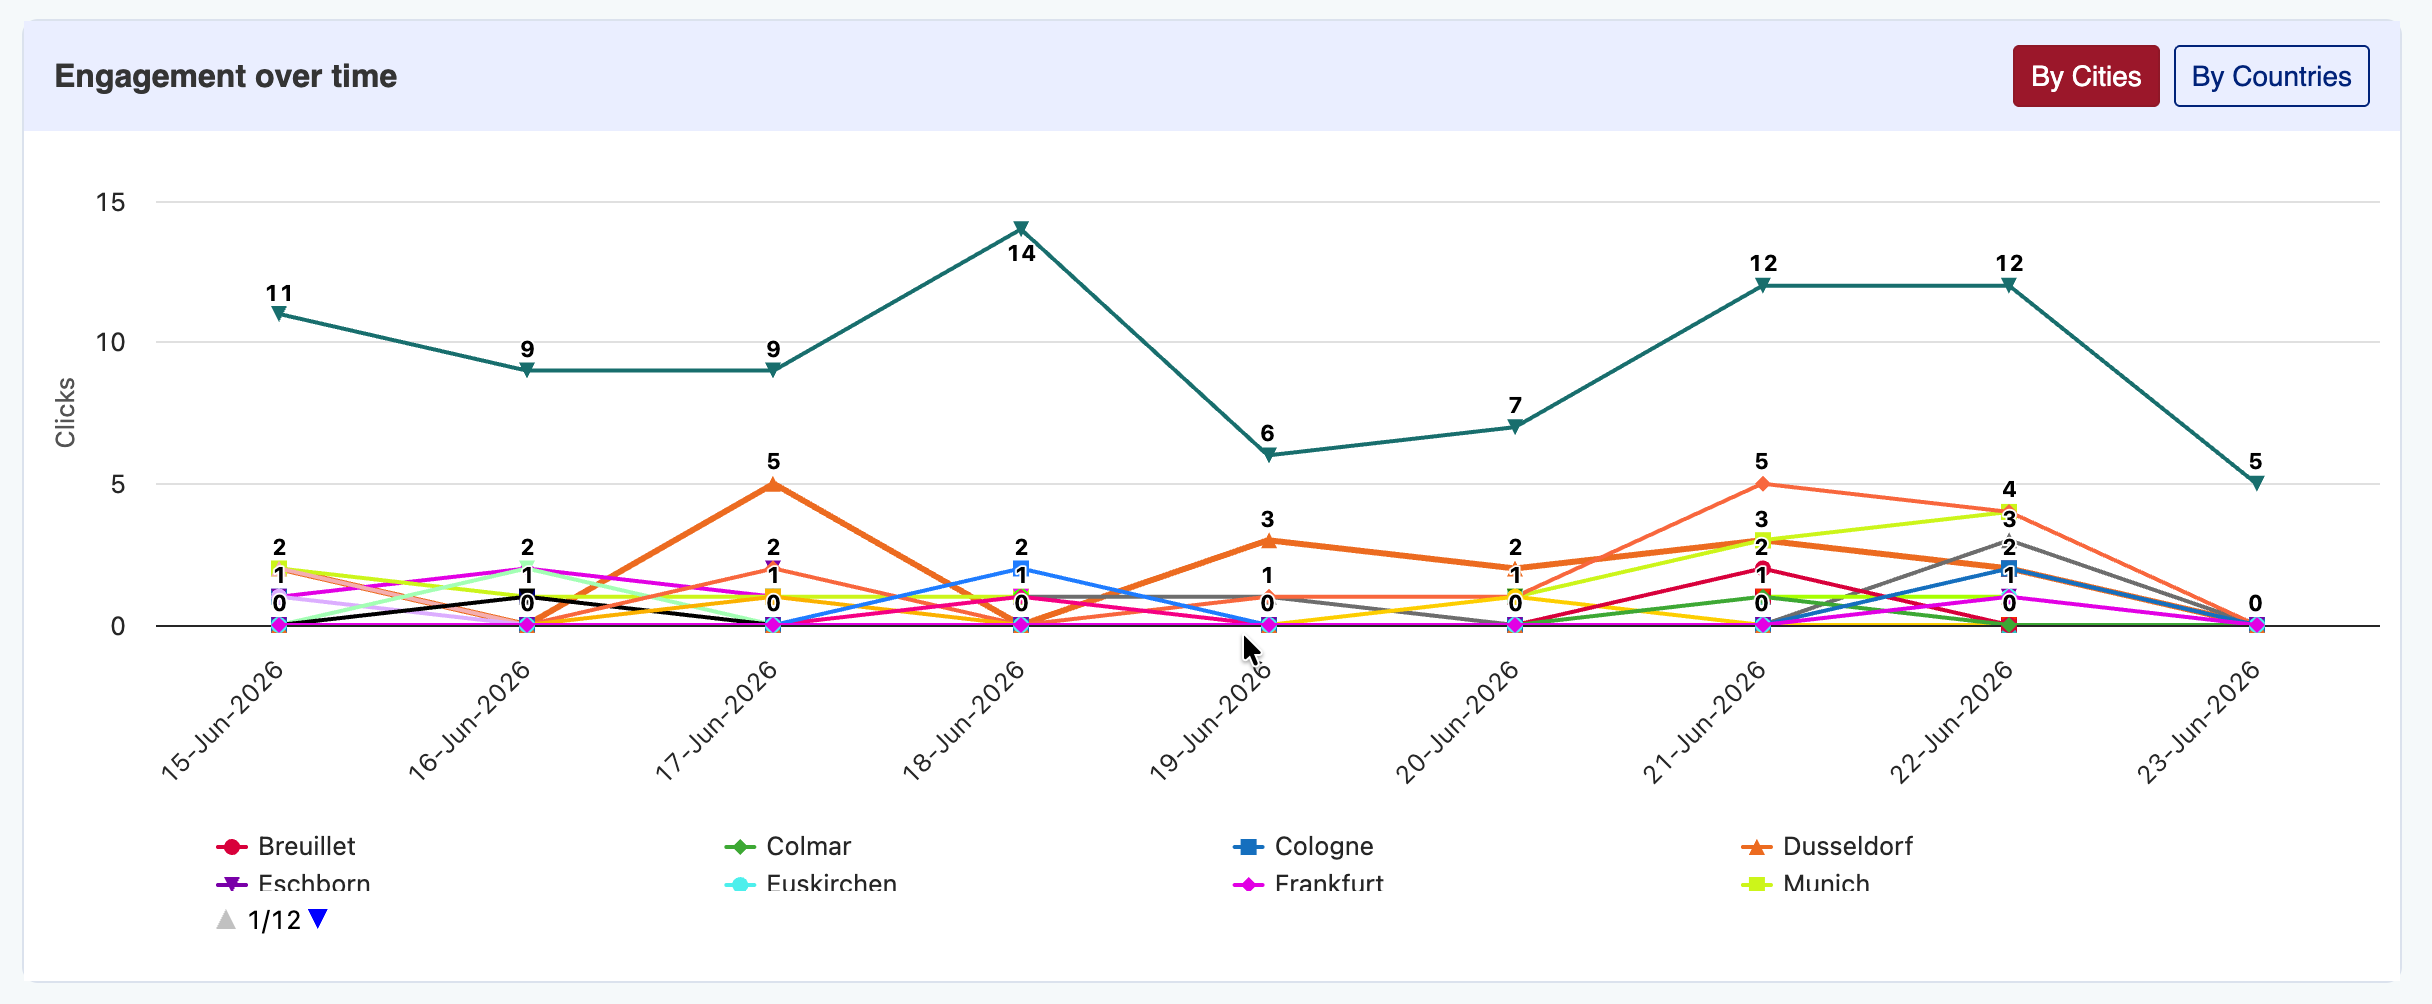
2. Live Charts
When you apply filters, the charts on this screen update instantly to show only that specific group:
- Location Chart: Use the Cities and Countries tabs to see exactly which places drive your filtered traffic.
- Tech & Source Charts: These pie charts update to match your filters.
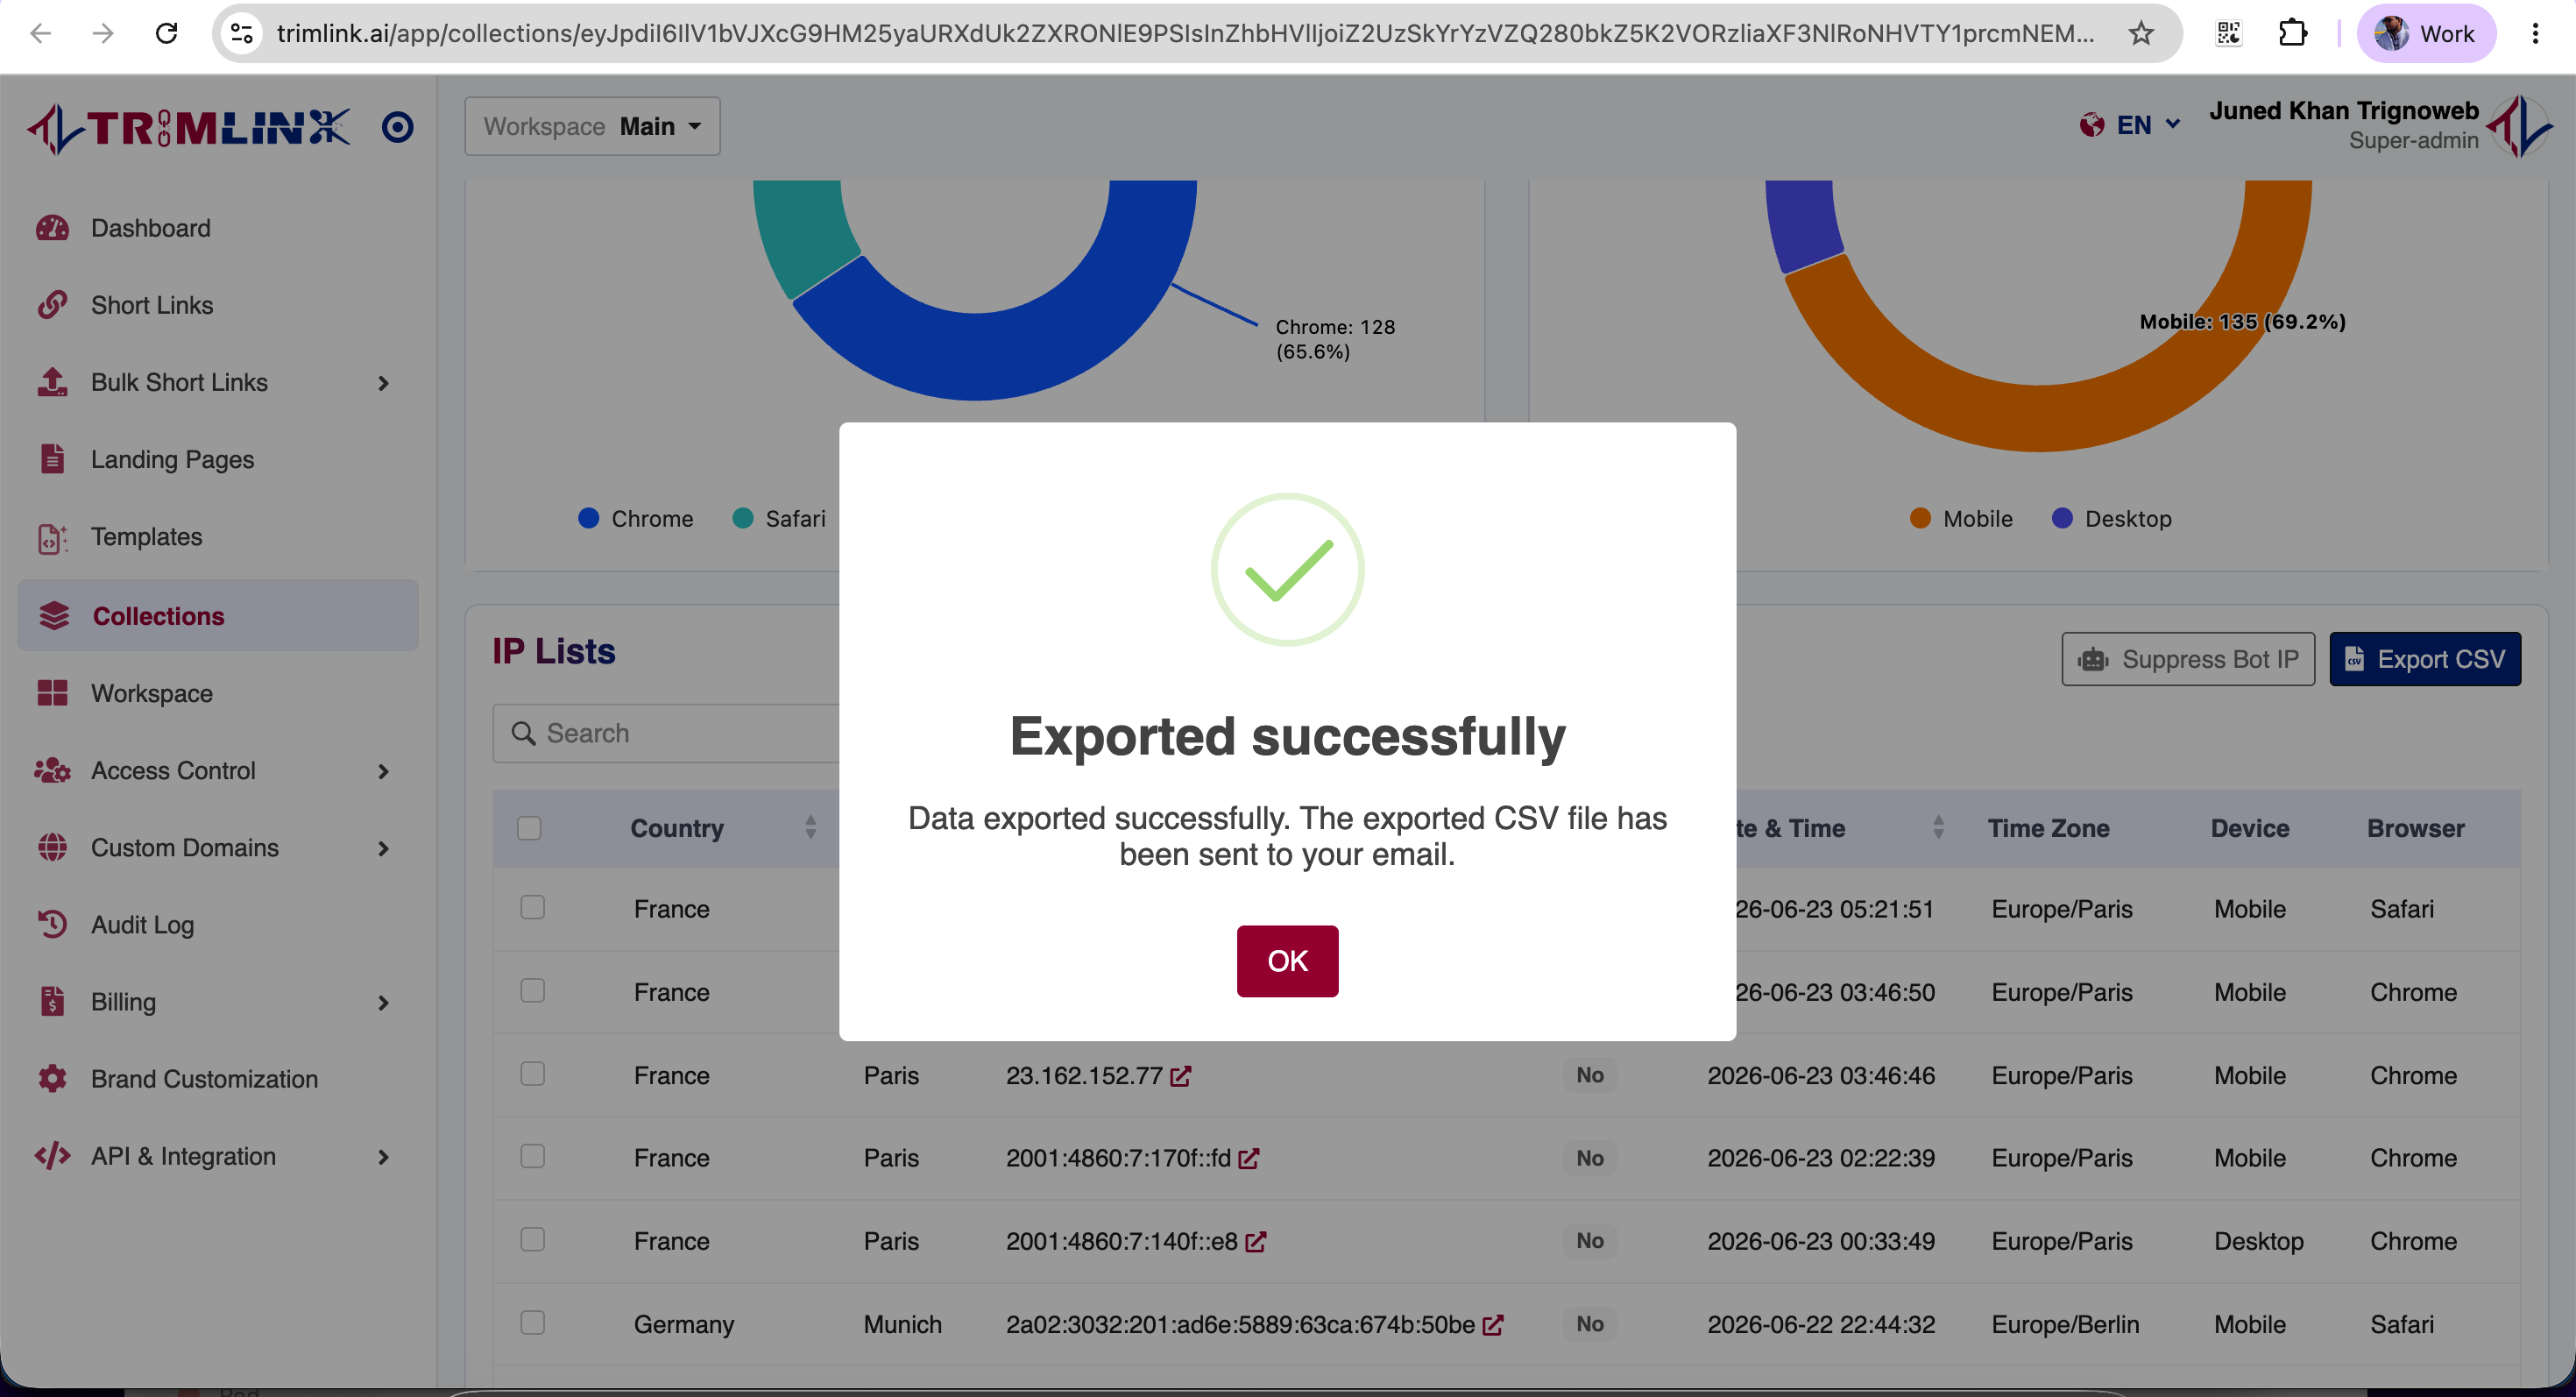
3. The IP List Table & Exporting
Below the charts is the IP List Table. This is a row-by-row log of every visit across all included links.
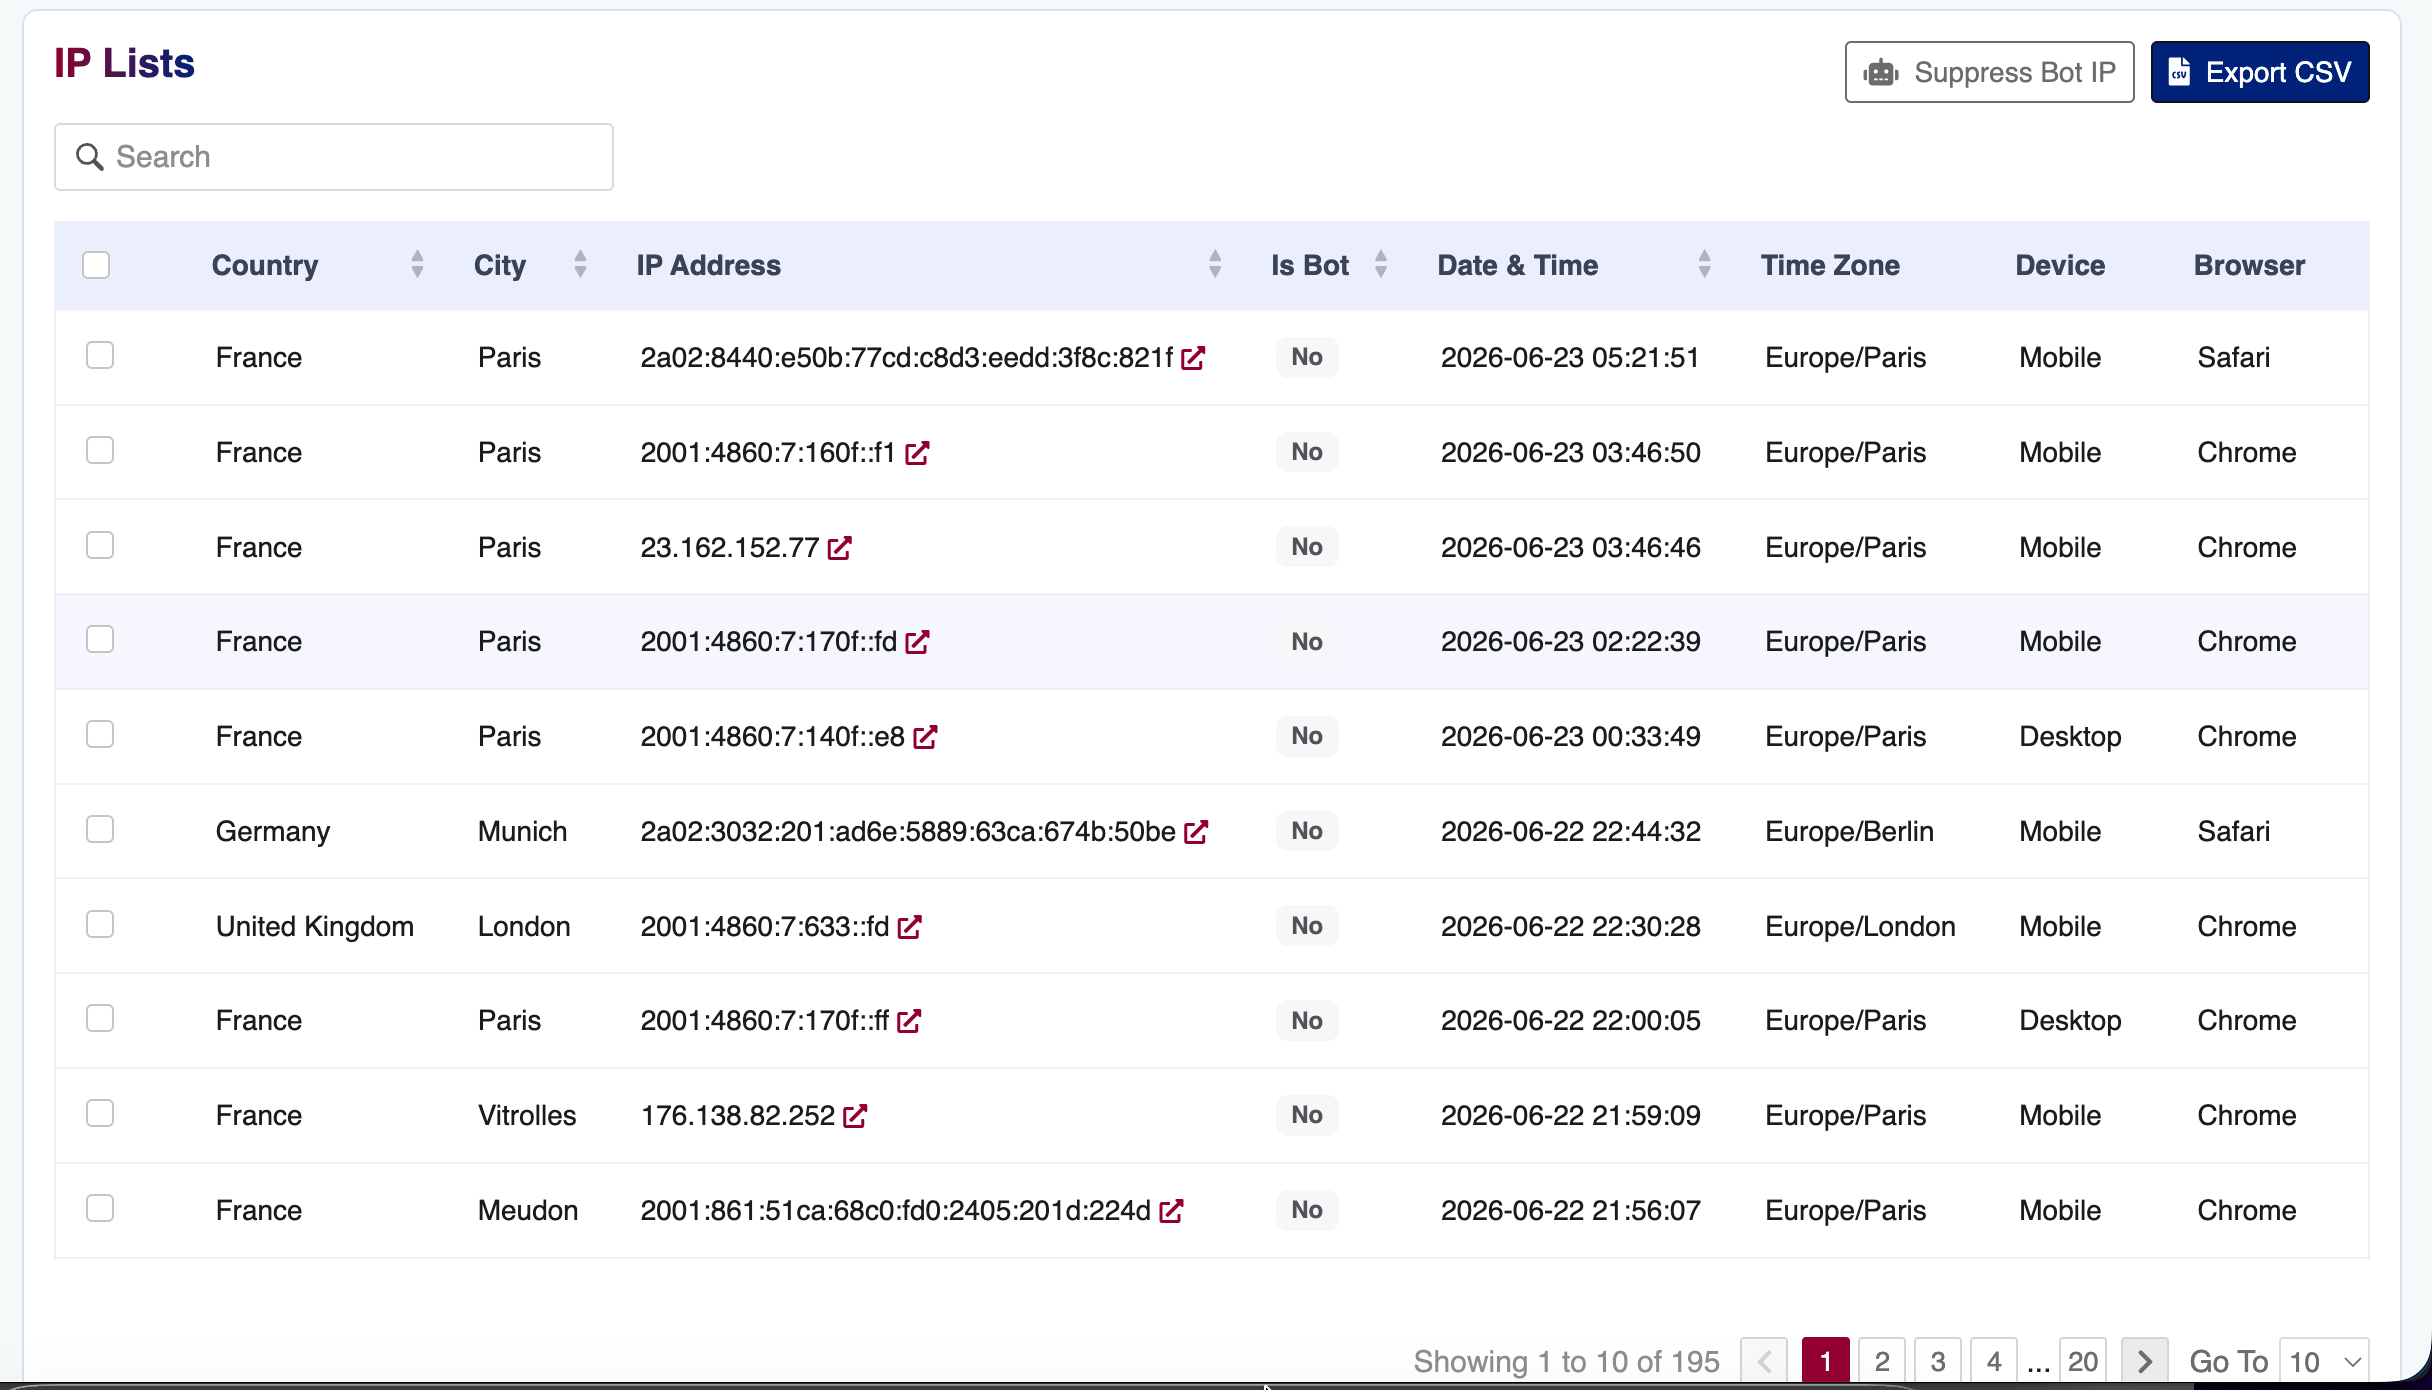
Important Note: This table only shows data based on the links you checked in Phase 1 and the filters you applied here. This keeps your list focused.
- Export the List: Click the Export button to download this table as a CSV file. You can use this spreadsheet of IP addresses, times, and locations for your own records.
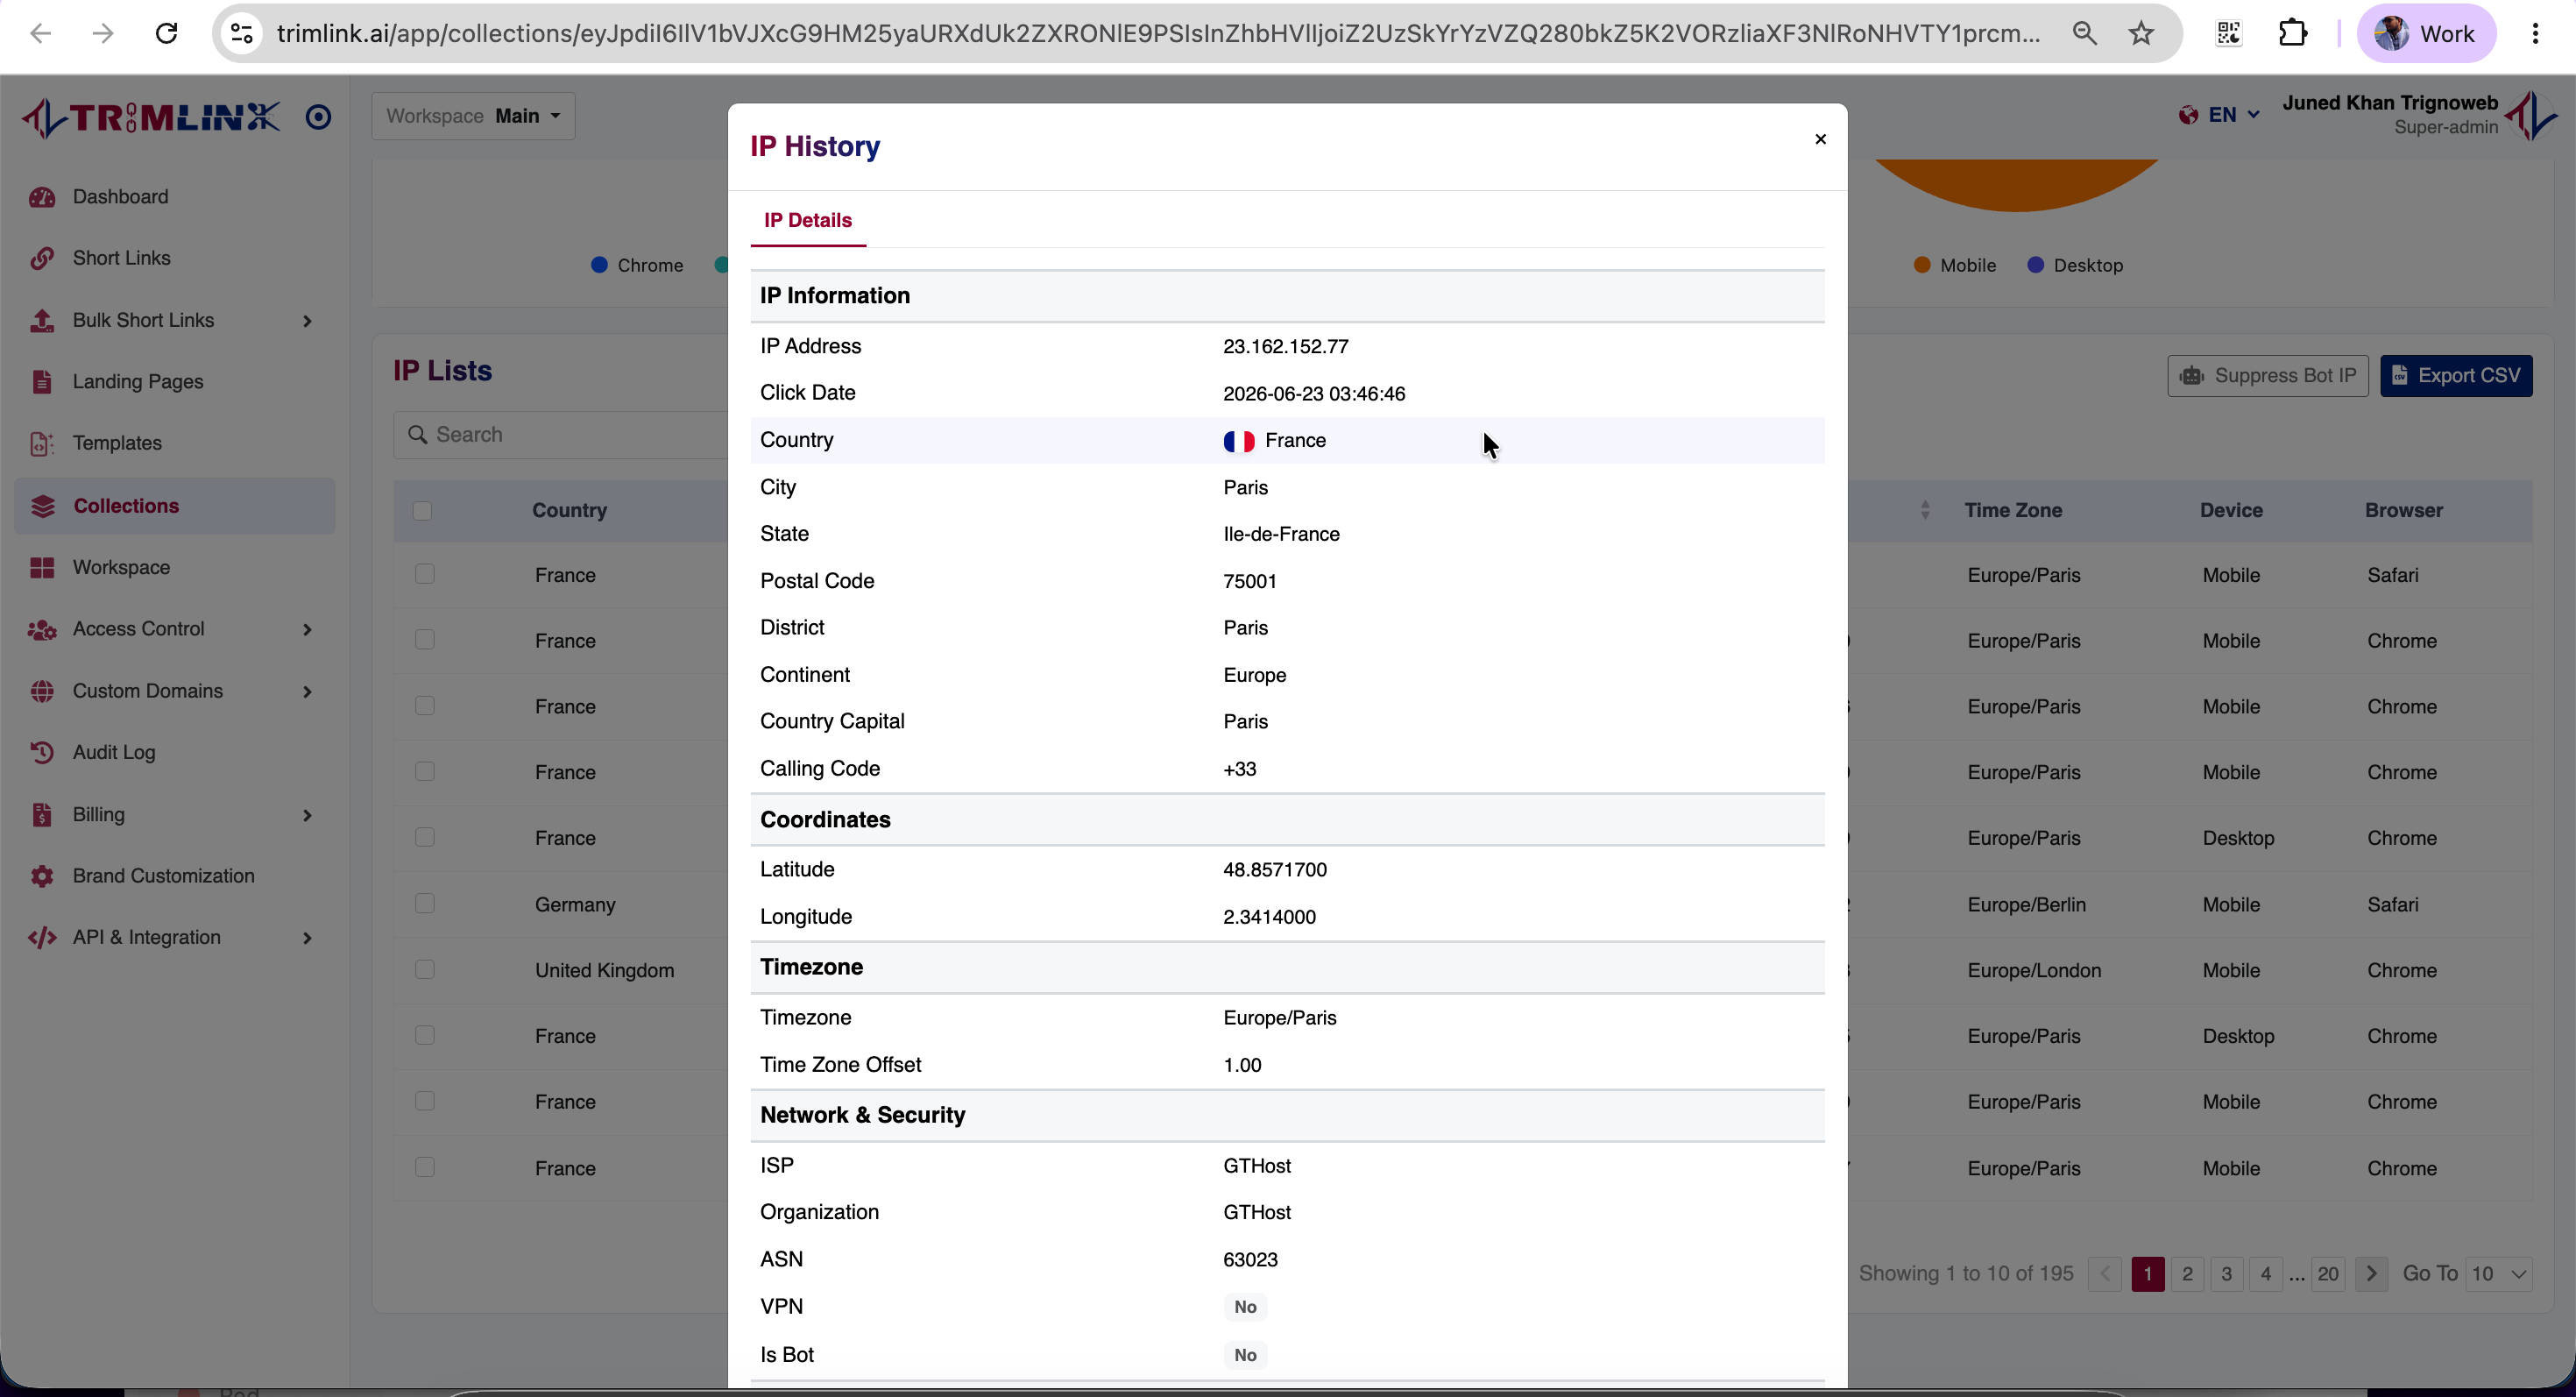
Phase 4: Individual Visitor Intelligence (The Modal)
Even with thousands of clicks, you can still check any single visit. Click on a row inside the IP List Table to open the Visitor Details.
Standard View: IP Information Tab
This tab shows data based on the visitor's network connection:
- IP Details: IP Address, Date, Country, City, State, District, Zip Code, Continent, and Calling Code.
- Timezone: Local Timezone and Time Zone Offset.
- Network & Security: Internet Provider (ISP), Organization, ASN, VPN Status, and Bot Status.
- Device & Browser: Device Type, Brand, OS version, Browser version, and where the click came from.
Advanced View: GPS Geo Location Tab
If you turned on exact GPS tracking for a link, and the visitor agreed, you will see a Geo Location tab. This tab shows highly precise GPS coordinates and physical street addresses.
Phase 5: Traffic Quality (Human vs. Bot)
Computer bots can ruin your data and waste your ad money. Trimlink automatically checks visitor behavior to spot bots across your whole folder.
Human & Bot Checks
- Human Traffic: Real customers, leads, and normal visitors.
- Bot Traffic: Security scanners, automated crawlers, and search engines.
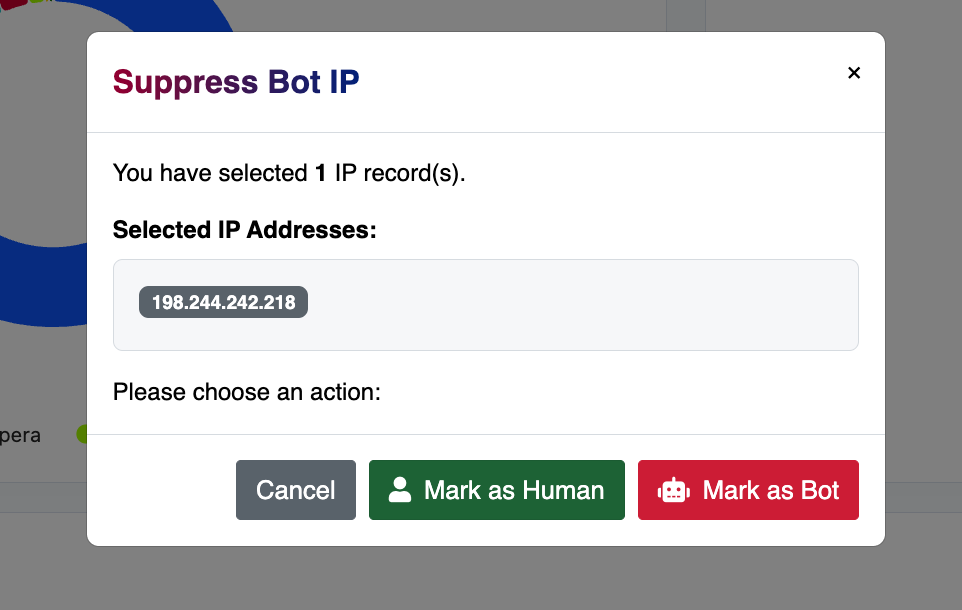
Manual Changes
Sometimes the system makes a mistake. You can fix this manually.
- Mark as Human: Use this if the visitor is actually from a trusted company network or a known customer. This adds their clicks back to your main numbers.
- Mark as Bot: Use this if you spot fake traffic or scanners. This removes their clicks from your clean data.
Phase 6: Data Management
You can export your data for reports and records. Because this is a collection, your exports will include data from all checked URLs. You can export:
- Combined Visitor Records & Clicks
- Country, City, Browser, Device, & Source Reports
- IP Location Data & GPS Location Data
- Human & Bot Traffic Data
Phase 7: AI Insights & Campaign Help
Making spreadsheets by hand takes too much time. Trimlink includes an AI assistant that acts like your own data scientist. It turns your combined numbers into easy-to-read tips.
What the AI Checks
By looking at the entire collection, the AI spots things people often miss:
- Finding your best and worst performing links.
- Spotting big audience trends and new map locations to target.
- Checking traffic sources to tell you which ads work best.
- Giving tips on how to grow or change your campaign.
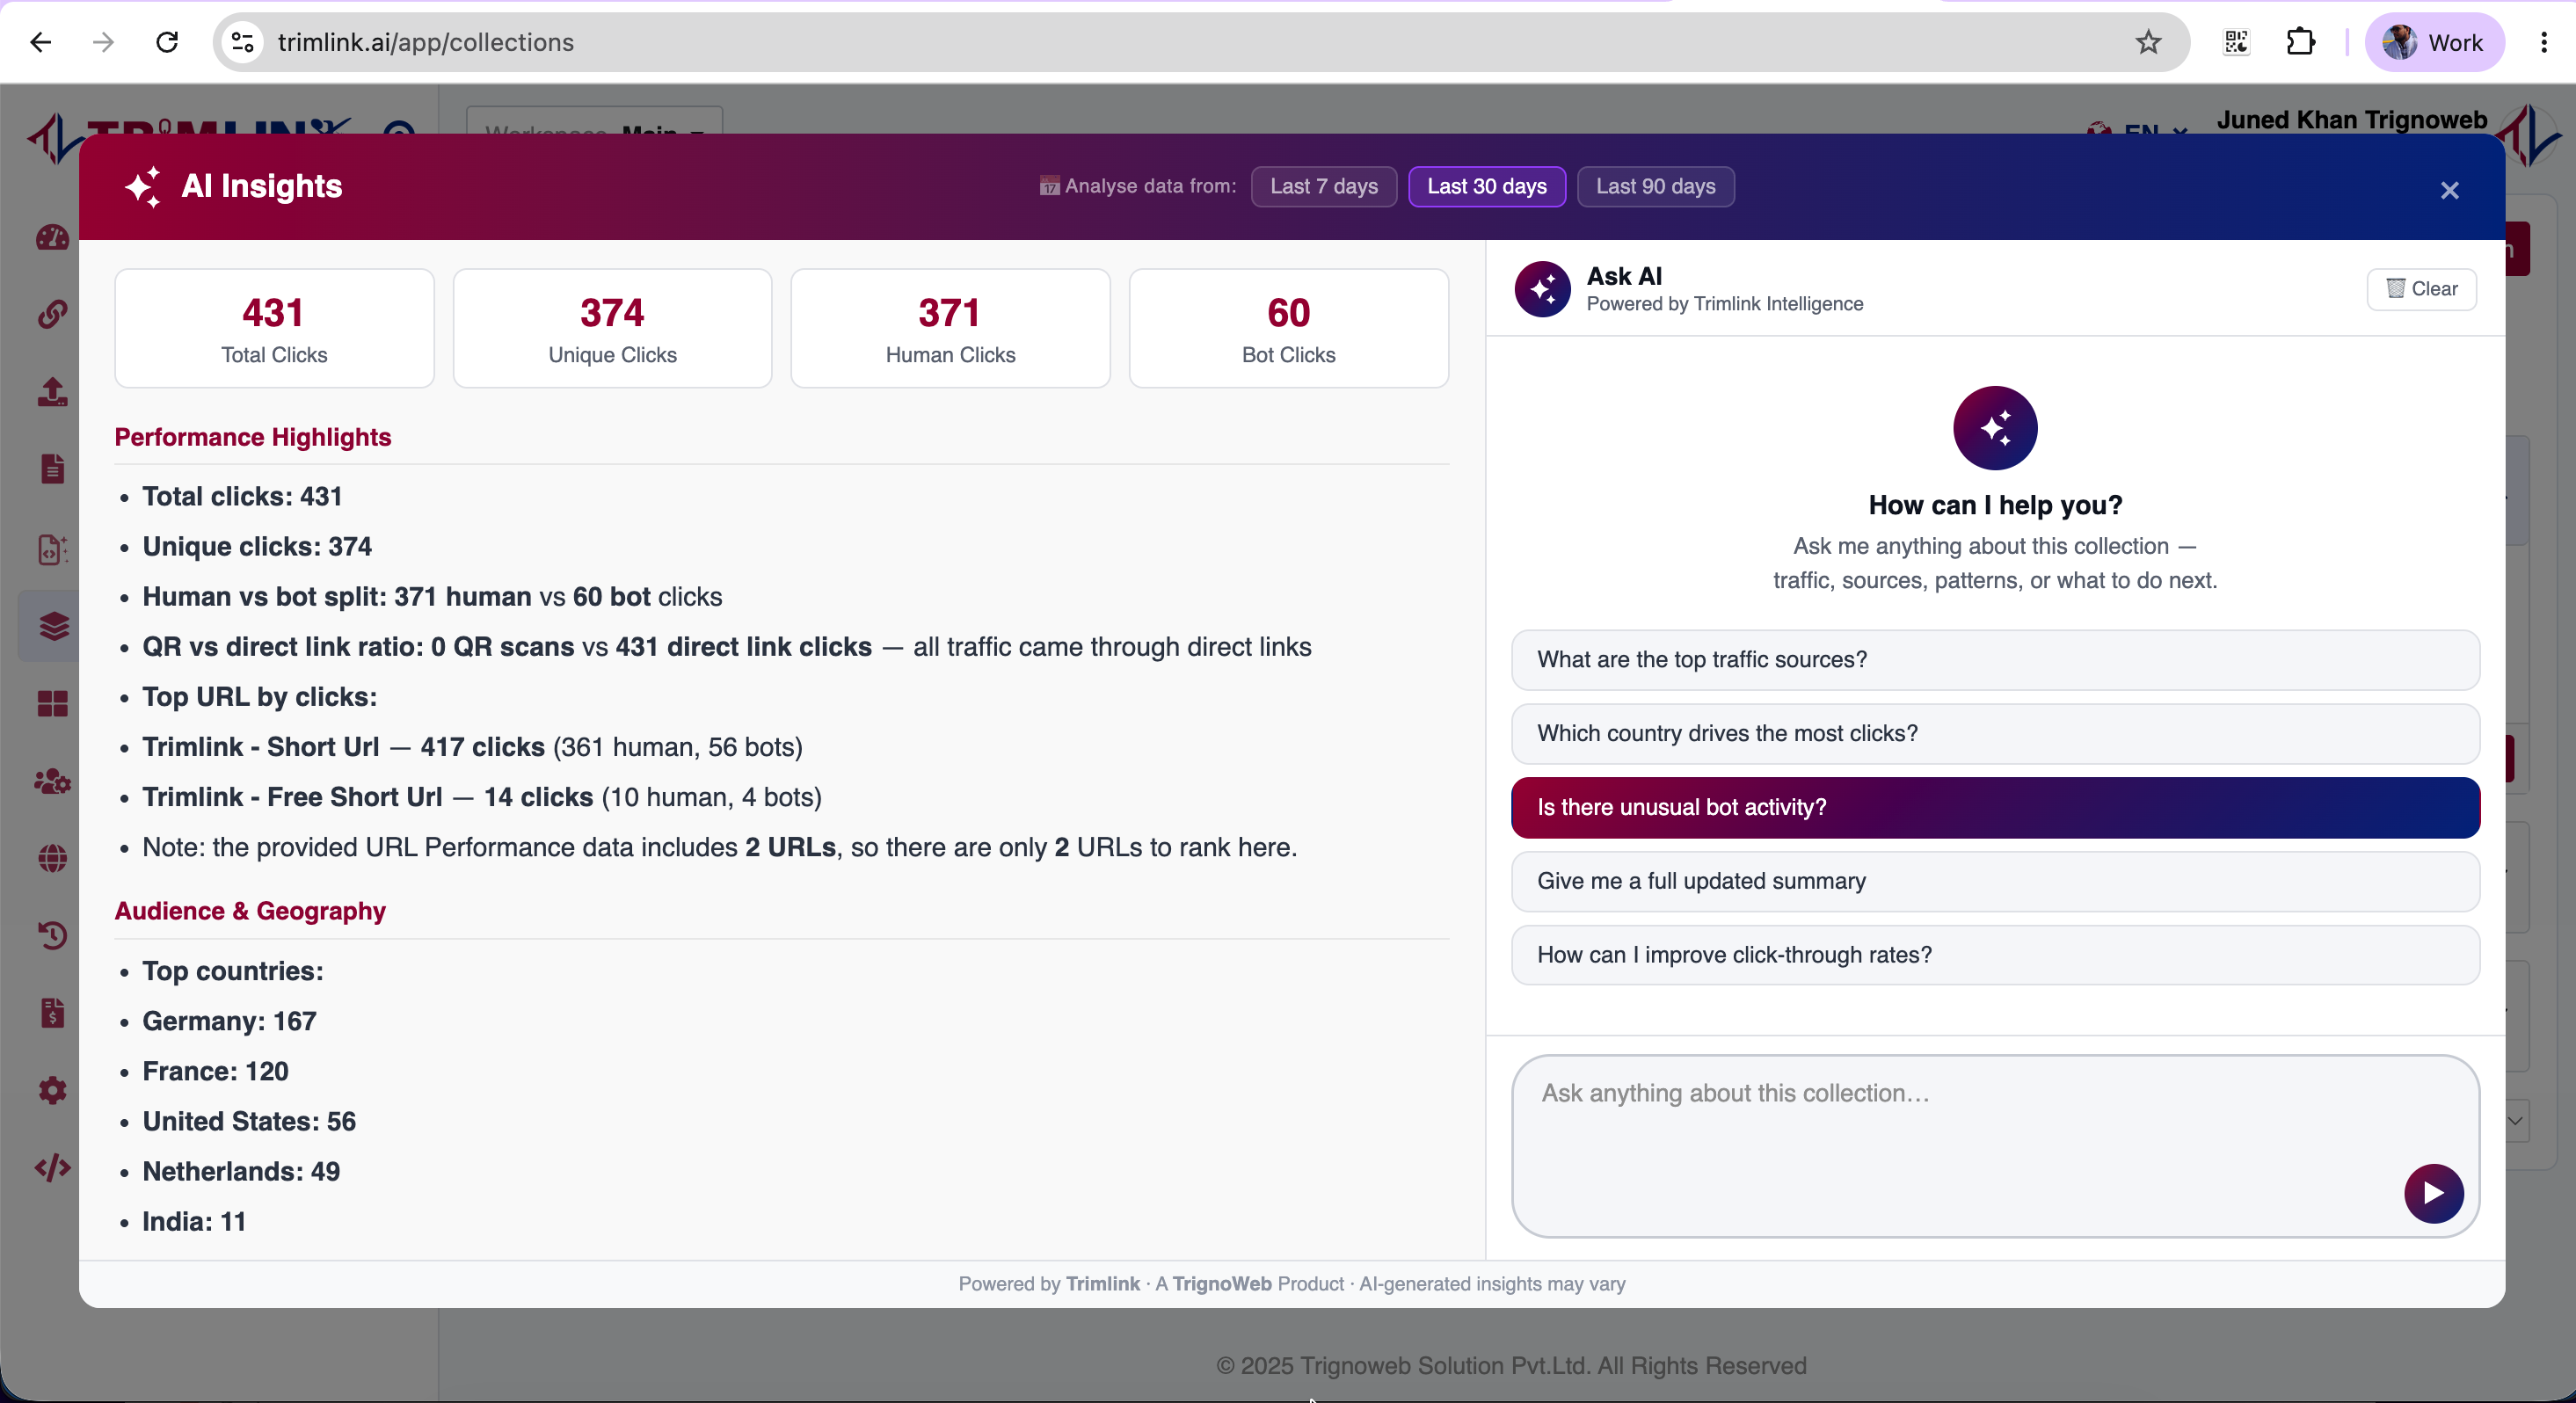
The AI Analytics Assistant
You can chat directly with your data. Ask questions like:
- "Summarize how this collection did over the last 30 days."
- "Which countries click the most on this campaign?"
- "Are mobile users doing better than desktop users here?"
- "Based on this data, where should we spend our next ad budget?"
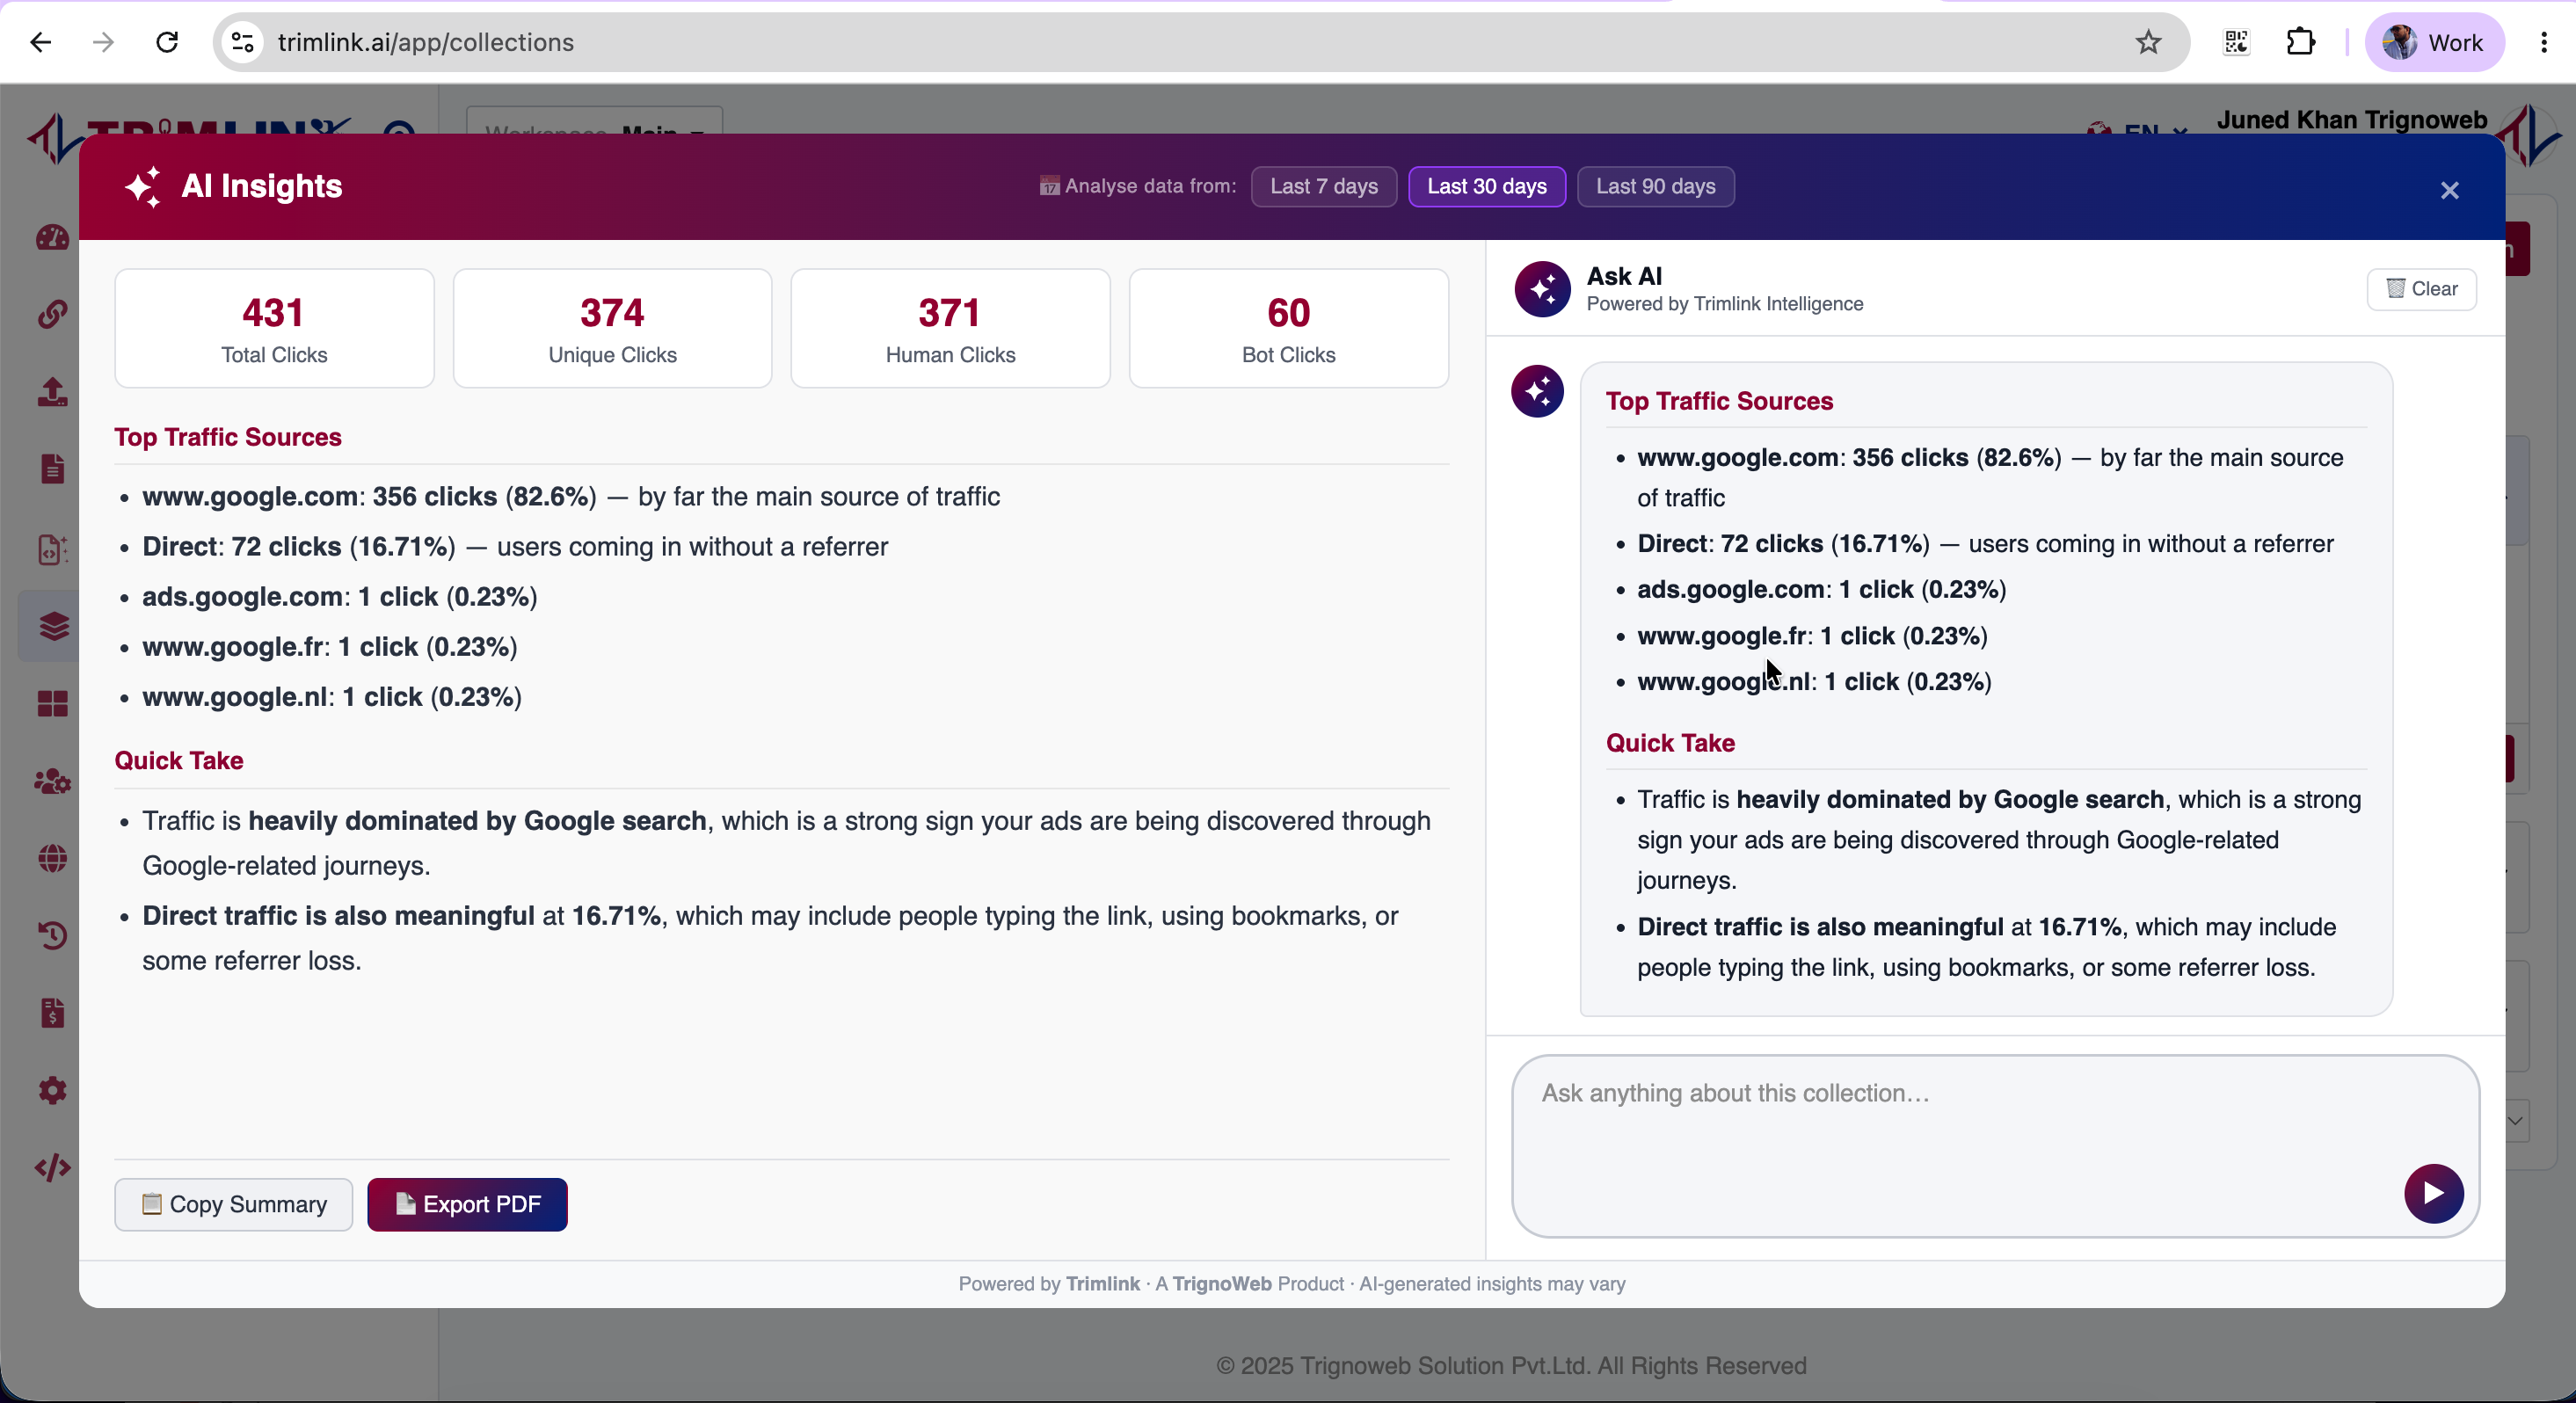
Exporting Professional Reports
Data is best when shared. Trimlink makes it easy to share your results.
- Copy Summary: Copy the AI's text to paste into an email or team chat.
- Export PDF: Click Export PDF to create a clean, professional report. These PDFs summarize your whole campaign so you do not have to make slides yourself.
Frequently Asked Questions
- Short Link Analytics shows data for one specific URL. Collection Analytics combines the data of every link and landing page in a folder. This gives you a big-picture view of your whole campaign.
- Yes. On the Collection Details page, uncheck links (like testing links) using the URL filter. The dashboard, map, and AI Insights will instantly update to show only the links you want.
- Yes. You can filter both the Overview and Deep-Dive screens by date. This helps you look at specific times, like weekends or holidays.
- Click 'View Detail' on any map cluster. Then, find the visitor in the IP List Table and click their row to see their full details.
- Yes. The AI looks at the combined data of your entire collection. It gives you tips and ideas based on how all your links perform together.
- Yes. You can download your data, visitor records, and map locations as CSV files. You can also save the AI campaign insights as professional PDF reports.
- Yes. If you turned on exact GPS tracking for your links, and the visitors allowed it, those locations will show up on the collection's map and reports.