Interactive Open API Documentation
The Trimlink OpenAPI (Swagger) interface provides a complete, interactive list of all available API endpoints. This page is designed to help developers test requests, explore capabilities, and integrate our services without needing to write complex code first.
API Reference Link: https://trimlink.ai/api/documentation
To ensure your API Reference documentation is professional and easy to navigate, here is the detailed description for Phase 1: Explore the API Categories. This section outlines how your API is organized and categorized within the documentation interface.
Phase 1: Explore the API Categories
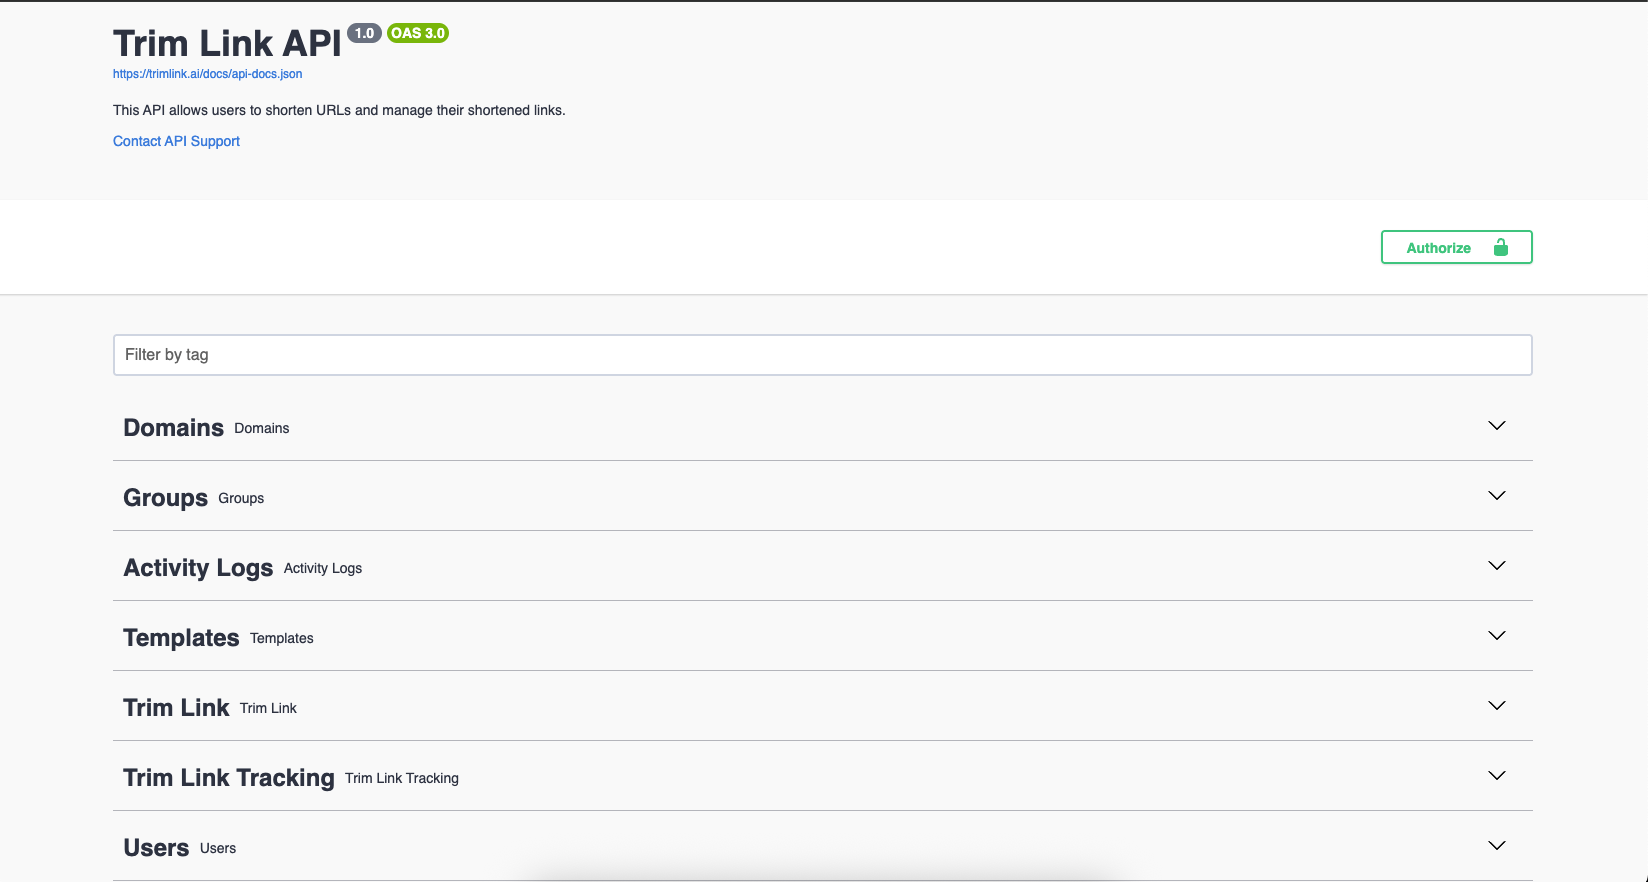
When you open the API documentation, you will see our endpoints organized into clear, logical categories. You can expand any category to view the specific actions available:
- Dashboard: Provides a high-level overview of your platform analytics and a summary of your workspace's performance.
- Users: Allows you to manage user profiles, update account settings, and handle permissions within your organization.
- Groups: Facilitates the management of group tags, helping you organize links and data effectively.
- Audit Logs: Provides a comprehensive listing of system activity, security events, and user actions for compliance monitoring.
- Shortlink: Contains the essential tools for creating, updating, and managing your shortened URLs.
- Shortlink Tracking: Enables deep analysis of link performance, including click-through rates, IP tracking, and geographic data.
- Workspaces: Allows for the management of your workspaces, including creation, updates, and configuration of environment-specific settings.
- Templates: Provides tools for managing your landing page designs and branding templates.
- Domains: Offers full management capabilities for connecting, verifying, and configuring your custom domains.
- Collection: Facilitates the management and organization of data collections for your specific needs.
Phase 2: Authorize the Explorer
To test the endpoints using your actual workspace data, you must authenticate the documentation page.
How to Authenticate
- Open your Trimlink dashboard and generate an API Access Token (as outlined in the previous guide).
- Navigate to the API Documentation page.
- Click the Authorize button (the padlock icon) near the top right of the screen.
- Paste your Access Token into the value box.
- Click Authorize to lock in your credentials.
All endpoints are now unlocked and ready to process your specific requests.
Phase 3: Execute Live API Requests
The Open API explorer allows you to send real requests and see live responses immediately. This is the fastest way to learn how our request and response formats are structured.
How to Test an Endpoint
- Click on any specific endpoint (e.g.,
GET /api/1.0/short-urls/list-all-short-urls) to expand it. - Click the Try it out button located on the right side of the expanded panel.
- If the endpoint requires parameters (like a specific link ID or date range), input them into the provided fields.
- Click the large blue Execute button.
- Scroll down to view the Server Response. You will see the exact HTTP status code (e.g.,
200 OK) and the formatted JSON data returned by our servers.
Critical Testing Note: The API explorer interacts with your live production data. If you use the
POST,PUT, orDELETEendpoints, you will actively create, modify, or permanently delete real links and domains from your Workspace. Please test destructive actions carefully.
Need Help? If you receive unexpected error codes while testing an endpoint, or if you need help structuring a complex JSON payload, please contact our technical team via our support page or email us at [email protected].
Frequently Asked Questions
- The API Reference is an interactive documentation page that lists every available API endpoint, showing you exactly what data you can send and receive.
- Swagger UI is the industry-standard tool we use to display our API documentation. It allows developers to visualize and interact with the API's resources without writing any code.
- Click the 'Authorize' button at the top of the page and paste your active Bearer Token. This unlocks the endpoints so you can test them securely.
- Yes. Once authorized, you can click the 'Try it out' button on any endpoint to send real requests and see live responses directly on the screen.
- Yes. The API documentation connects to your live Trimlink account. Any POST, PUT, or DELETE requests you make will actually create, modify, or delete your real data.
- You can generate a secure Access Token from the API Keys section inside your Trimlink dashboard.
- The Trimlink API strictly accepts and returns data in JSON (JavaScript Object Notation) format.
- All API endpoints are structured around our core base URL: https://trimlink.ai/api/1.0/
- Yes. Requests made through the interactive documentation count toward your standard Workspace rate limits.
- The Swagger interface provides the exact JSON structure and curl commands needed for your requests, making it easy to copy and paste into your own codebase.